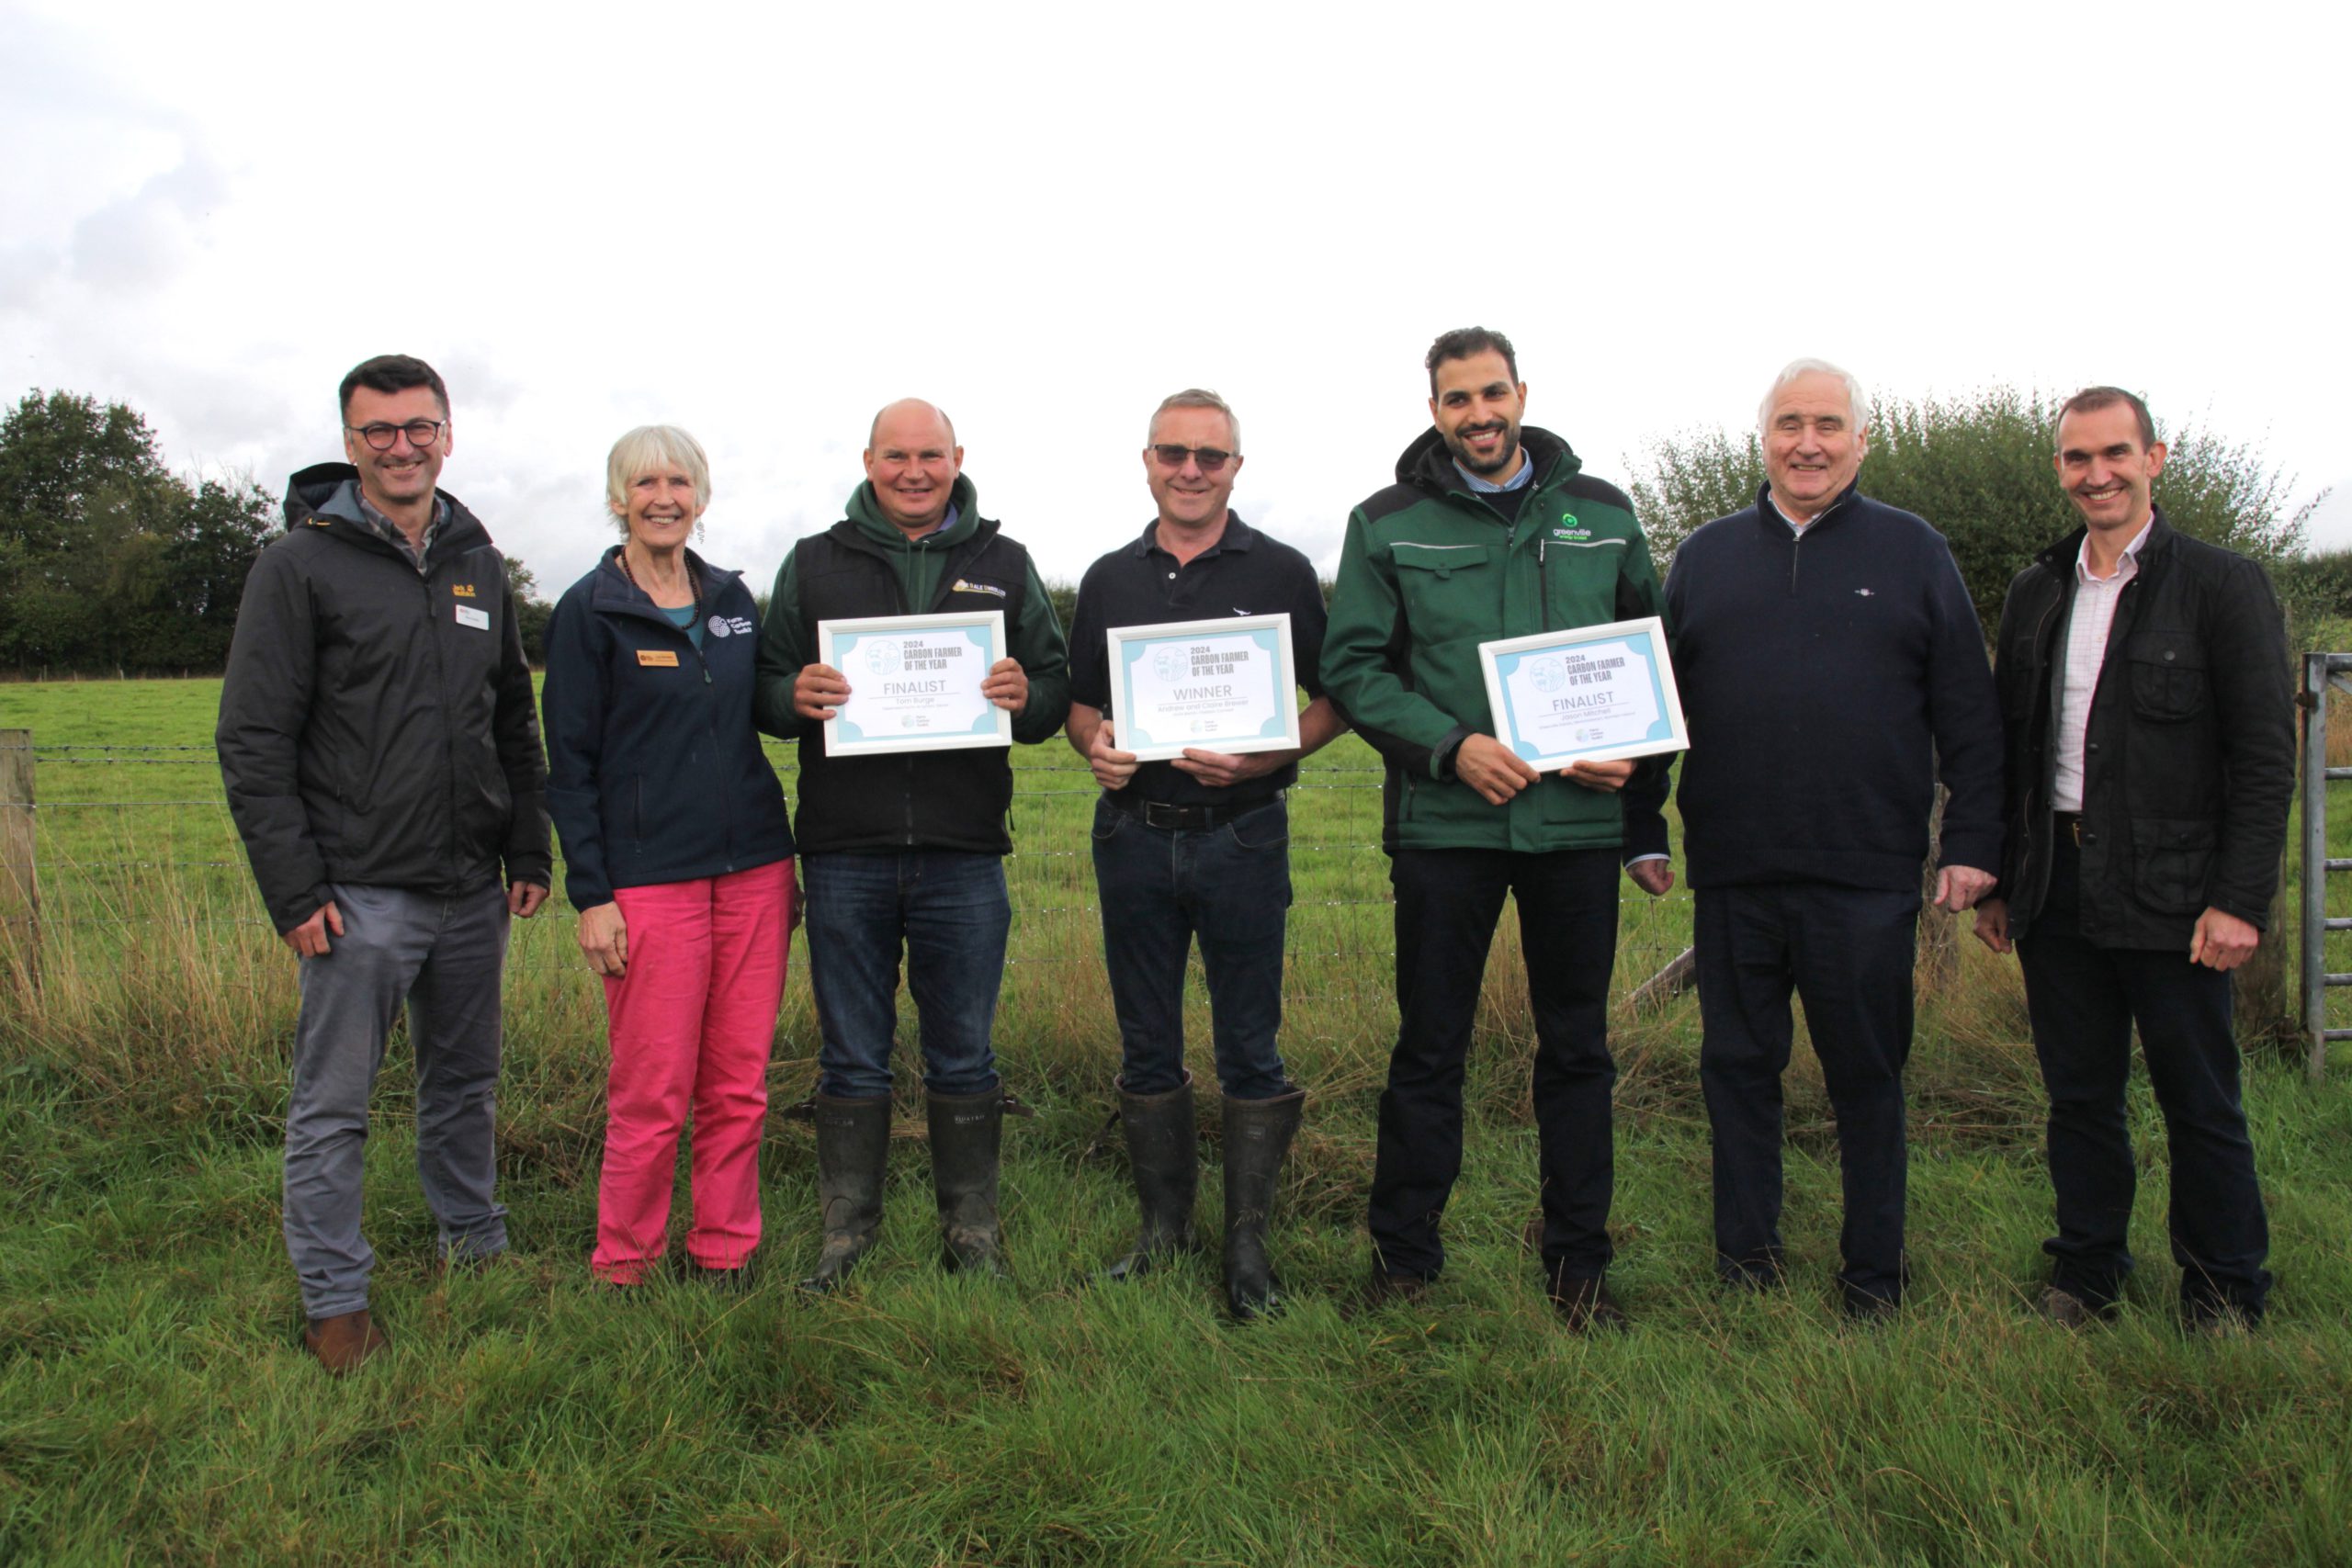
Now in its second year, the annual Carbon Farmer of the Year competition is organised by the Farm Carbon Toolkit and generously sponsored by HSBC Agriculture UK. The competition aims to find farmers and growers who are engaged with–and passionate about–reducing their business’s climate impact through changing management practices to reduce greenhouse gas (GHG) emissions.
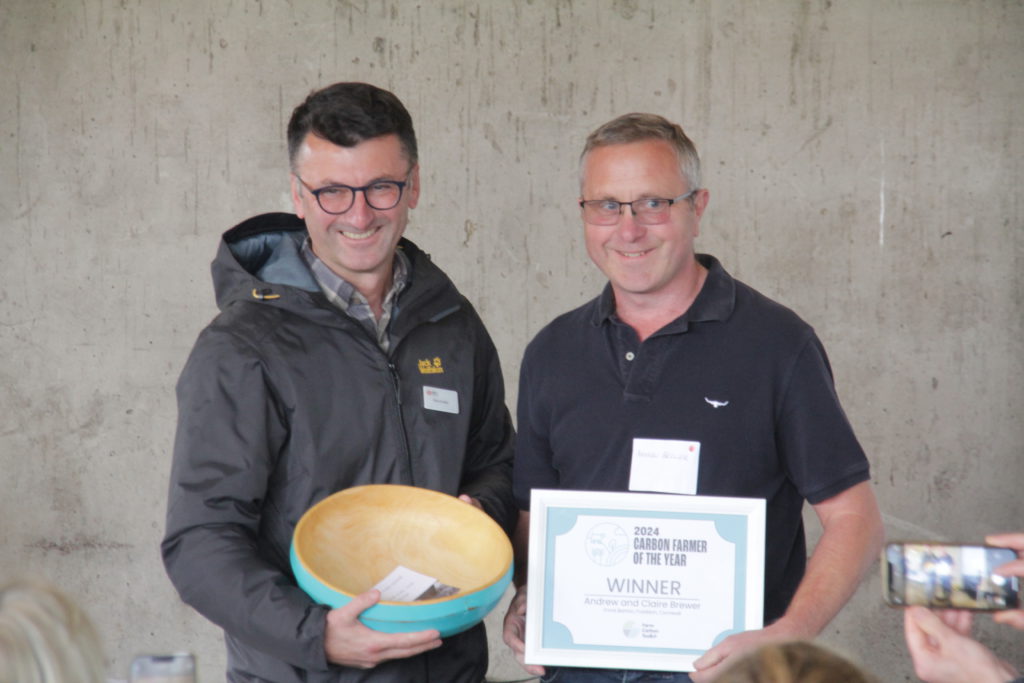
Andrew Brewer was awarded the Carbon Farmer of the Year Award for 2024, presented by Steve Dunkley, our sponsor from HSBC Agriculture (seen in the picture below).
Andrew Brewer, Winner of the Carbon Farmer of the Year Award for 2024 presented by Steve Dunkley, HSBC Agriculture UK
Andrew is part of the Farm Net Zero project and low GHG farming has been a top priority for him and his farm for a number of years. He manages 500 Jersey X dairy cows across his 400 Ha farm in Fraddon, Cornwall. He stood out to the judges for his understanding and application of a range of practices to enable his pasture-based dairy farm to remove atmospheric carbon into soil, trees, and hedges, while simultaneously minimising farm GHG emissions by focusing on maximising forage intake for his dairy cows and minimising inclusion of supplementary concentrate feeds. Andrew also selectively breeds his cows to work well within his pasture-based system. There is an opportunity to tour his farm during a farm walk he is hosting on November 8th.
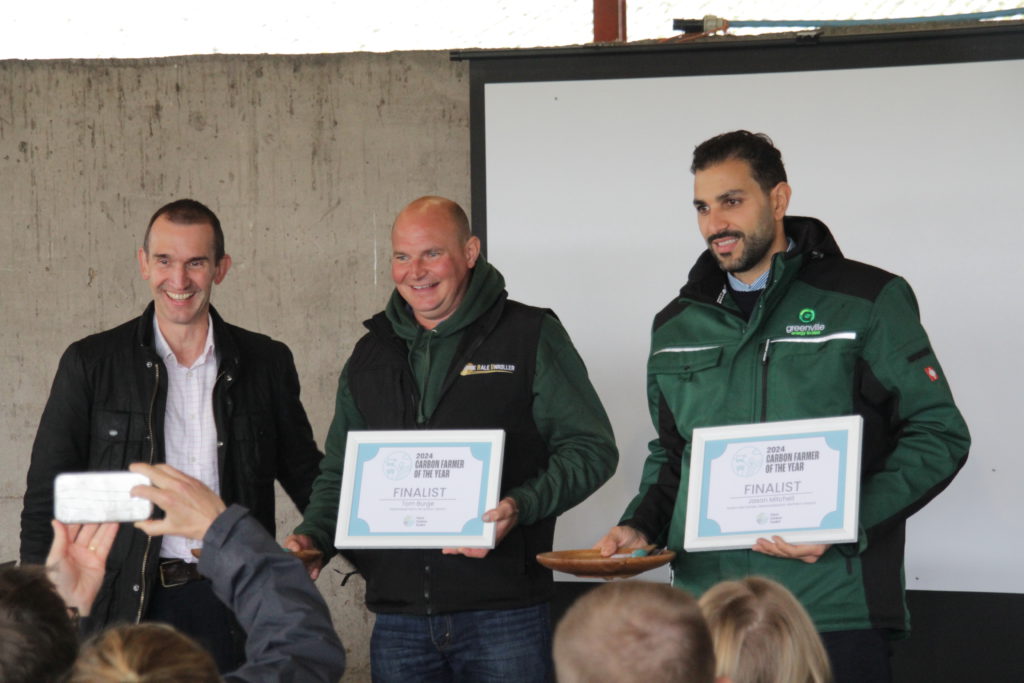
The other two finalists, Tom Burge and Jason Mitchell were praised for their continued efforts to mitigate greenhouse gas emissions in their businesses. The finalists awards were presented by David Cope, Head of Sustainability at the Duchy of Cornwall who was also on the panel of judges (seen below). Tom Burge, who featured in the mob grazing workshop has done fantastic work cultivating a low input grazing system which has seen vast improvements in his grass quality and sequestration potential.
Similarly, Jason Mitchell is a Director of Greenville Dairies Ltd based in Newton Stewart, Northern Ireland. He has also been recognised for his continued effort to farm in a low carbon management system. At Greenville Dairies they have reduced emissions from their 850 strong dairy herd, largely through the application of genomics leading to greater feed efficiency alongside the development of a significant Anaerobic Digestion facility which sees them now taking in food waste alongside utilisation of cow manure to produce electricity, liquid natural gas (LNG) and digestate. Electricity and LNG are sold to the grid and to Companies such as Lakeland Dairies (their customer for their milk).
Tom Burge and Greenville Dairies, Carbon Farmer of the Year 2024 finalists, with David Cope, Head of Sustainability at the Duchy of Cornwall
Competition judges, Steve Dunkley (HSBC UK), David Cope (Head of Sustainability at Duchy of Cornwall), and Liz Bowles (CEO Farm Carbon Toolkit) were very impressed with the commitment and innovation shown by all the finalists in identifying sources of GHG emissions on their farms and developing strategies to both reduce emissions and increase the rate of carbon removal into soils and non-crop biomass.
Liz Bowles, Chief Executive Officer at Farm Carbon Toolkit, says:
Once again, the Carbon Farmer of the Year competition has identified some truly inspirational farmers. All our finalists have made great strides in reducing business reliance on fossil fuels through changes to their farming practices and careful soil management to reduce GHG emissions and sequester carbon.
It was particularly positive to see a dairy farm winning this year’s competition, given that dairy farming is often in the media spotlight for its adverse environmental impact. We are looking forward to showcasing the many effective ways that our finalists are reducing on-farm emissions and increasing carbon storage for others to see at free farm walks over the coming months. Watch this space!
Steve Dunkley, HSBC UK Agriculture, says:
HSBC UK Agriculture is pleased to support the 2024 Carbon Farmer of the Year competition. The quality of entries has been superb and hugely inspiring. As a business, we’re very keen to support the agriculture industry in transitioning towards net zero. While that will take many forms, we have the ambition to help farmers fund investment in the new practices and technologies needed to evolve.
The Carbon Farmer of the Year competition is a great way of showcasing how farmers are already achieving these changes and encouraging others to follow their lead
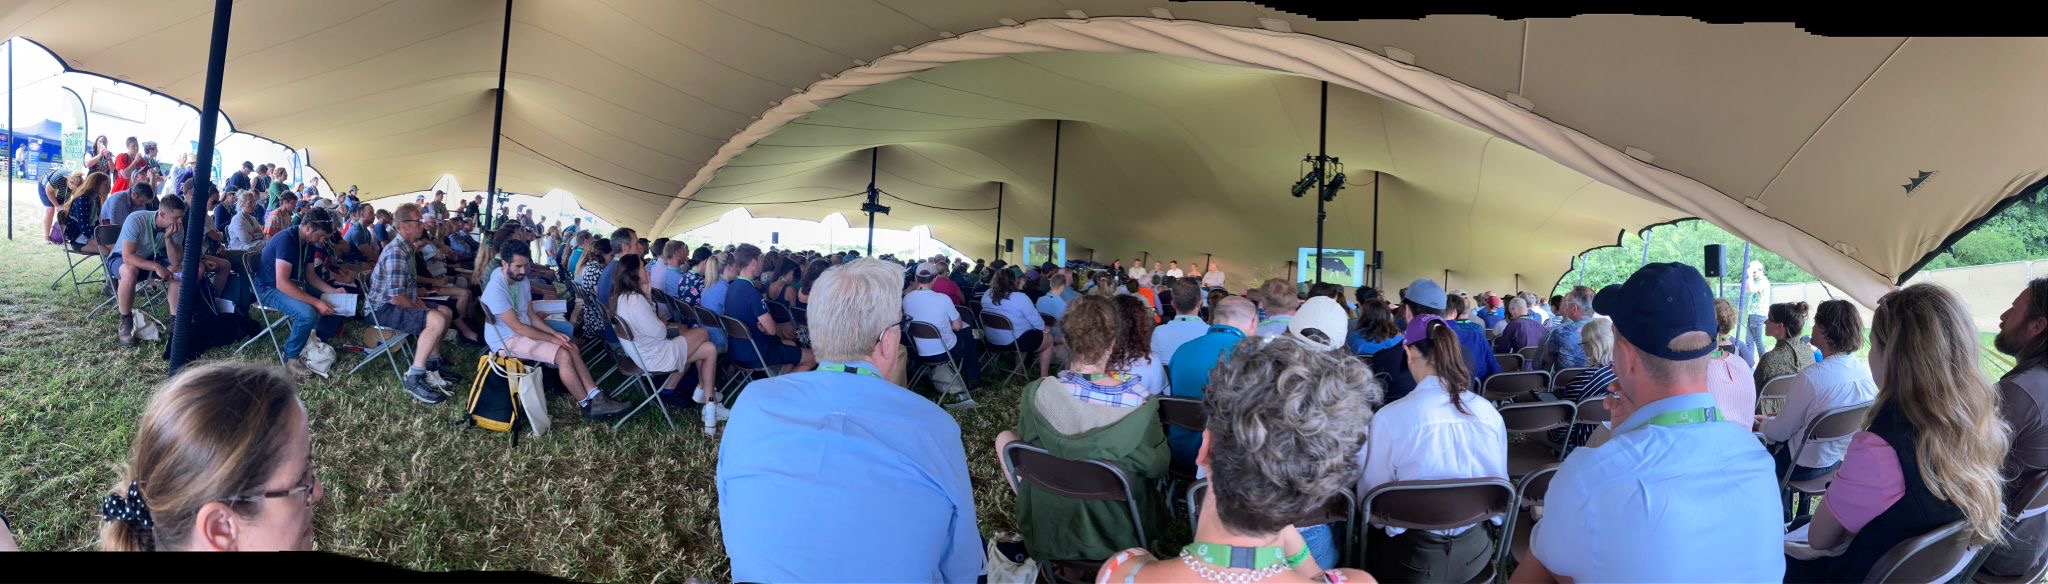
The FCT field day was an event to shine a light on the sustainable solutions benefiting farmers economically, socially and environmentally. The focus was on mixed agricultural systems, as well as celebrating those who are doing the most to reduce greenhouse gas emissions and sequester carbon into their soils.
On the 25th September 2024, our Annual Field Day brought together farmers from all over the country, including the winners of our past FCT Soil and Carbon Farmer of the Year competitions, to hear about the exciting developments in sustainable agriculture. In addition, we were grateful to HSBC UK Agriculture who helped sponsor the Carbon Farmer of the Year Competition and to all our supporters of the Annual Field Day – Cross Compliance Solutions, First Milk, Shearwell, Velcourt and Yeo Valley.
The event was held at Boycefield Farm in Dilwyn, courtesy of Billy Lewis, Soil Farmer of the year (2022) and the Lewis family. The day was a grey one with a few showers but did not dampen any spirits or the curiosity of the farmers that enjoyed the day!
Our delegates arrived ready for a 10am start which was officially kicked off by a welcome from FCT CEO Liz Bowles and an introduction to the farm by host Billy Lewis.
Opening comments by Billy Lewis to all the guests
Billy Lewis – Our host and 2022 Soil Farmer of the Year talking about how the farms’ approach of integrating livestock and herbal leys into a previously intensive arable system has rejuvenated soil health, drastically reduced fertiliser and feed inputs, whilst boosting profitability. Billy also mentioned the challenges his farm has been facing, with the changing climate and consistently wet weather proving to be high on the list.
We enjoyed a circuit of the farm to join workshops on subjects including adapting arable rotations to build fertility and resilience in a changing climate, mob grazing and the importance of soil testing. We heard about developments that have been made on Boycefield farm, as well as from farmers implementing similar systems across the country.
We have captured a snapshot of the workshops below:
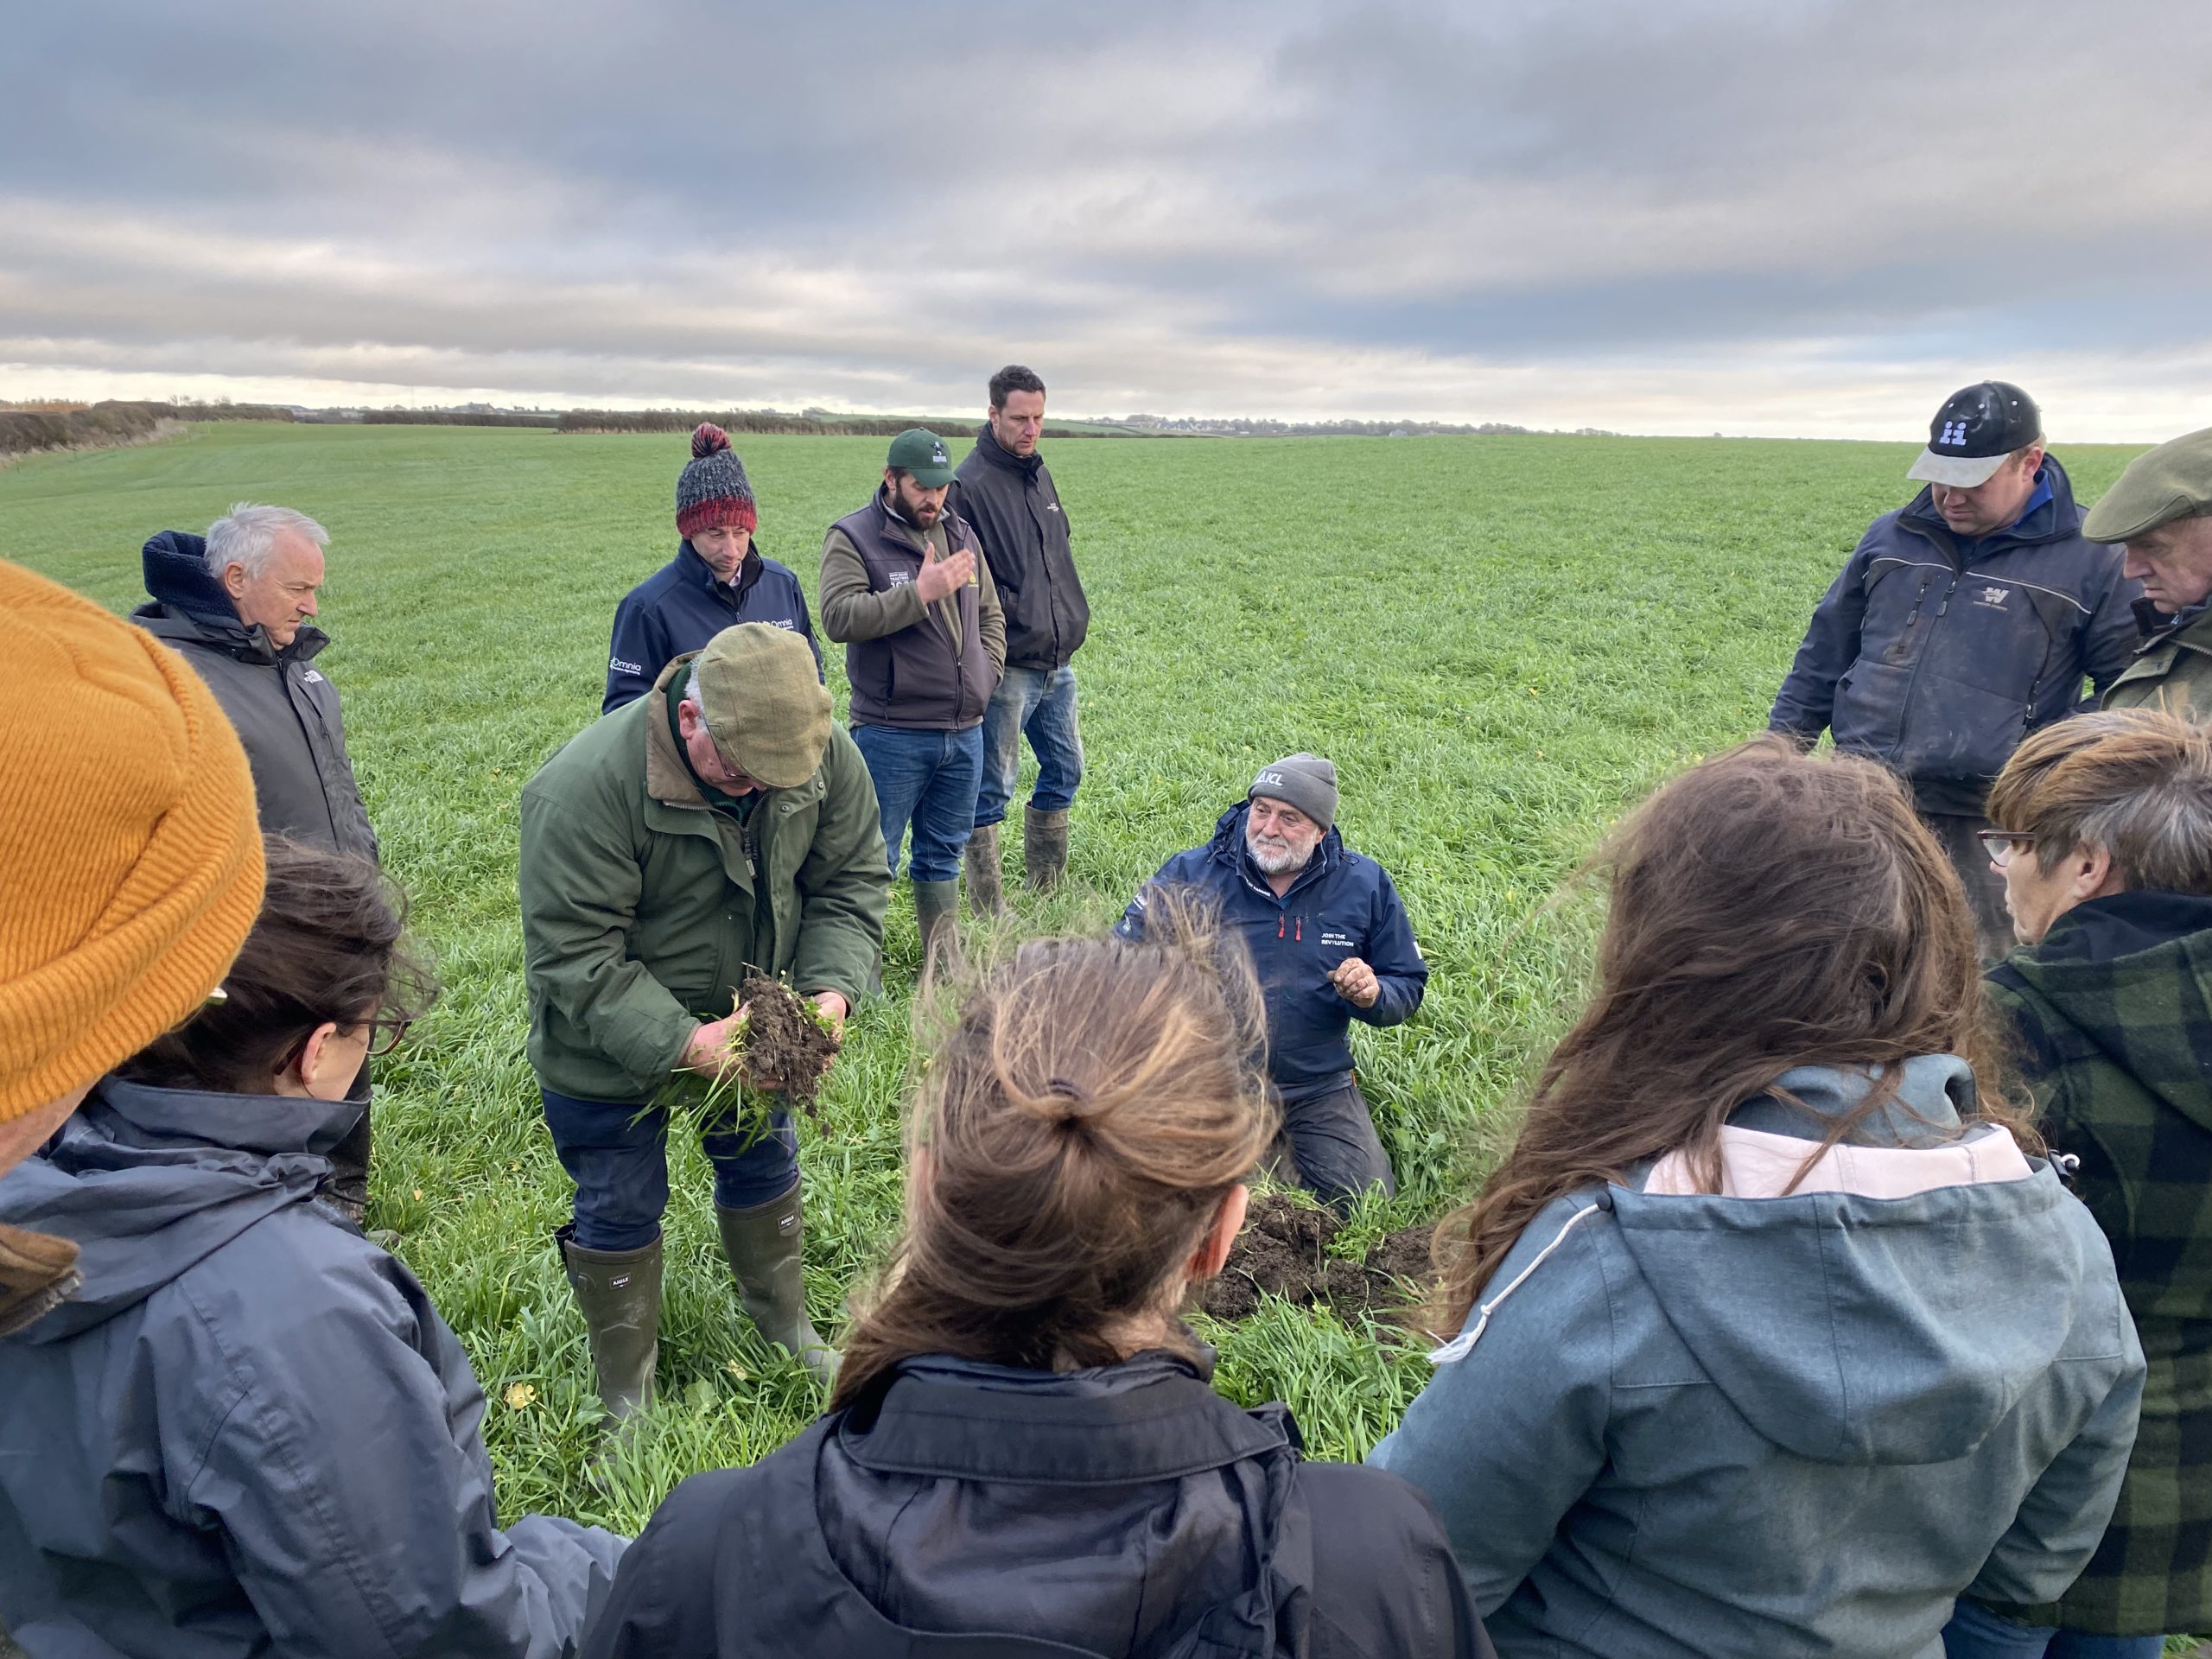
Soil clinic – chaired by Becky Willson (FCT)
We heard from our very own Becky Wilson and Niels Corfield, a regenerative agriculture advisor.
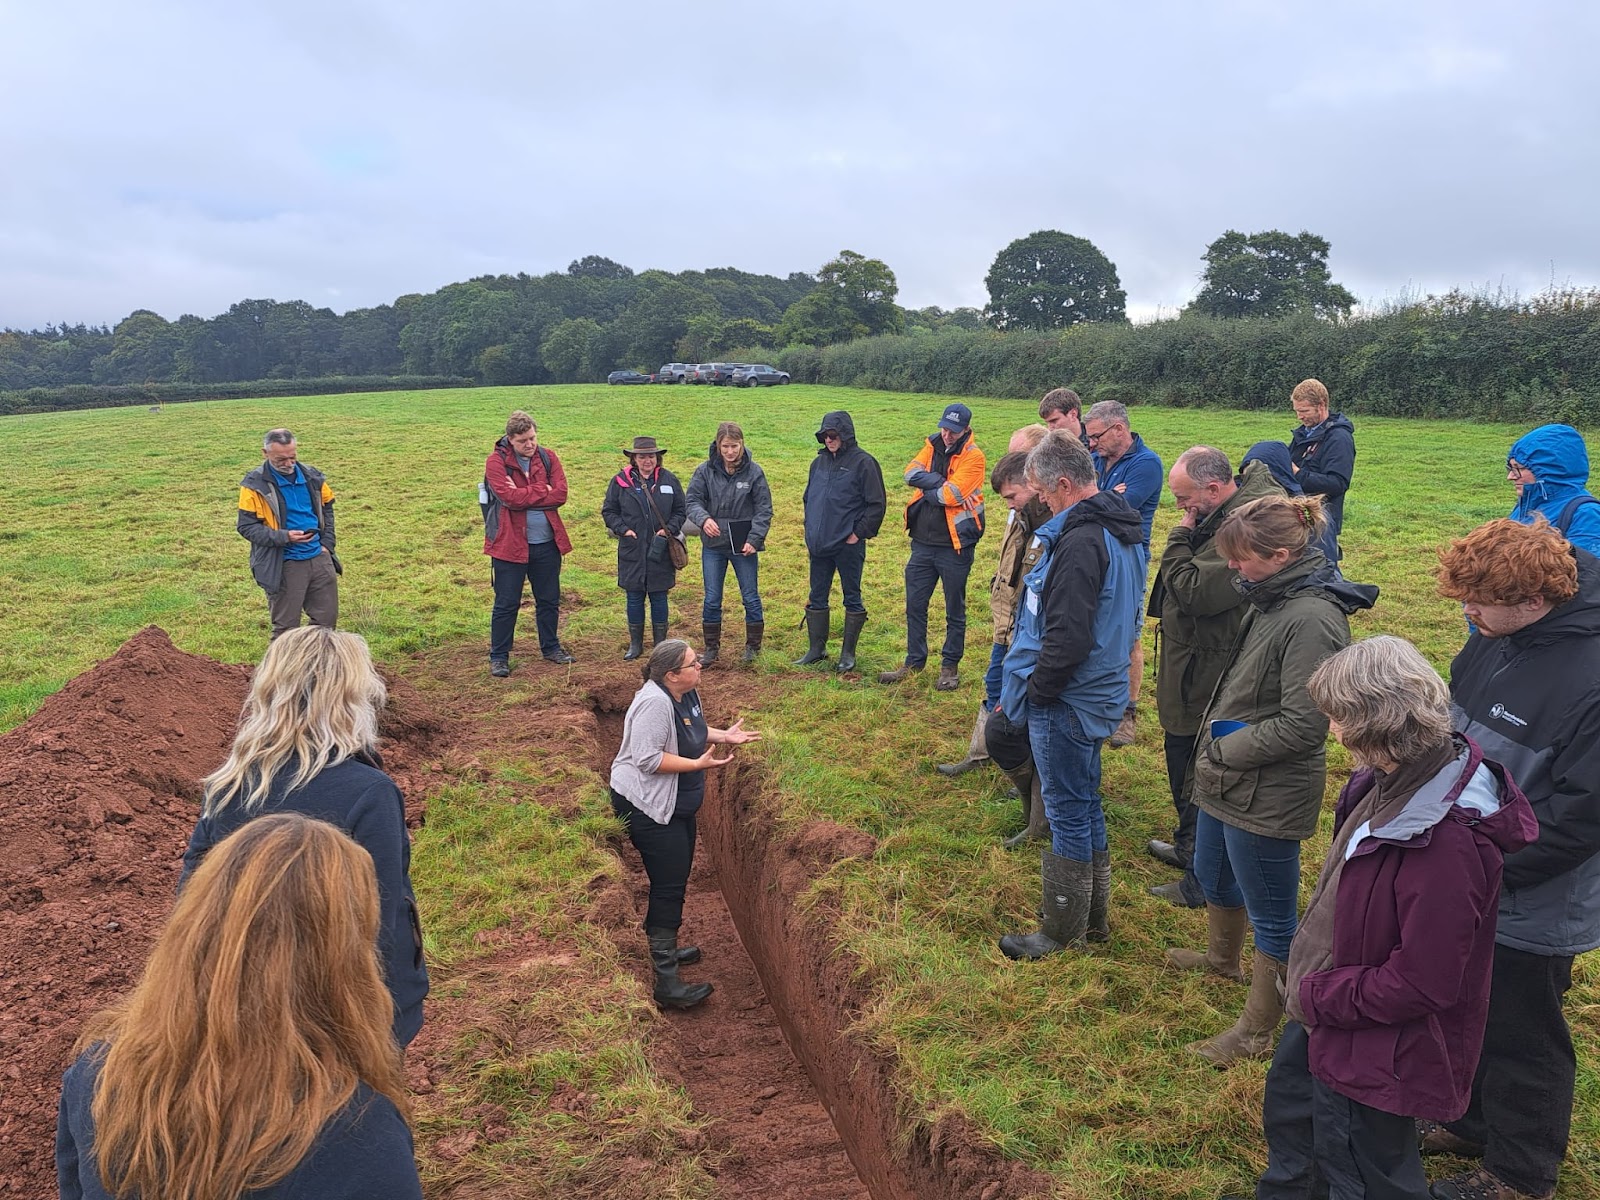
Becky standing in the soil pit explaining the benefits of upkeeping healthy soil to the group
Niels and Becky focussed on firstly, and most importantly, how the health of the soil is crucial to any agricultural system. Having a deeper understanding of what to look for within the soil aids farmers in assessing their own soils and tailoring their systems to increase soil health and fertility.
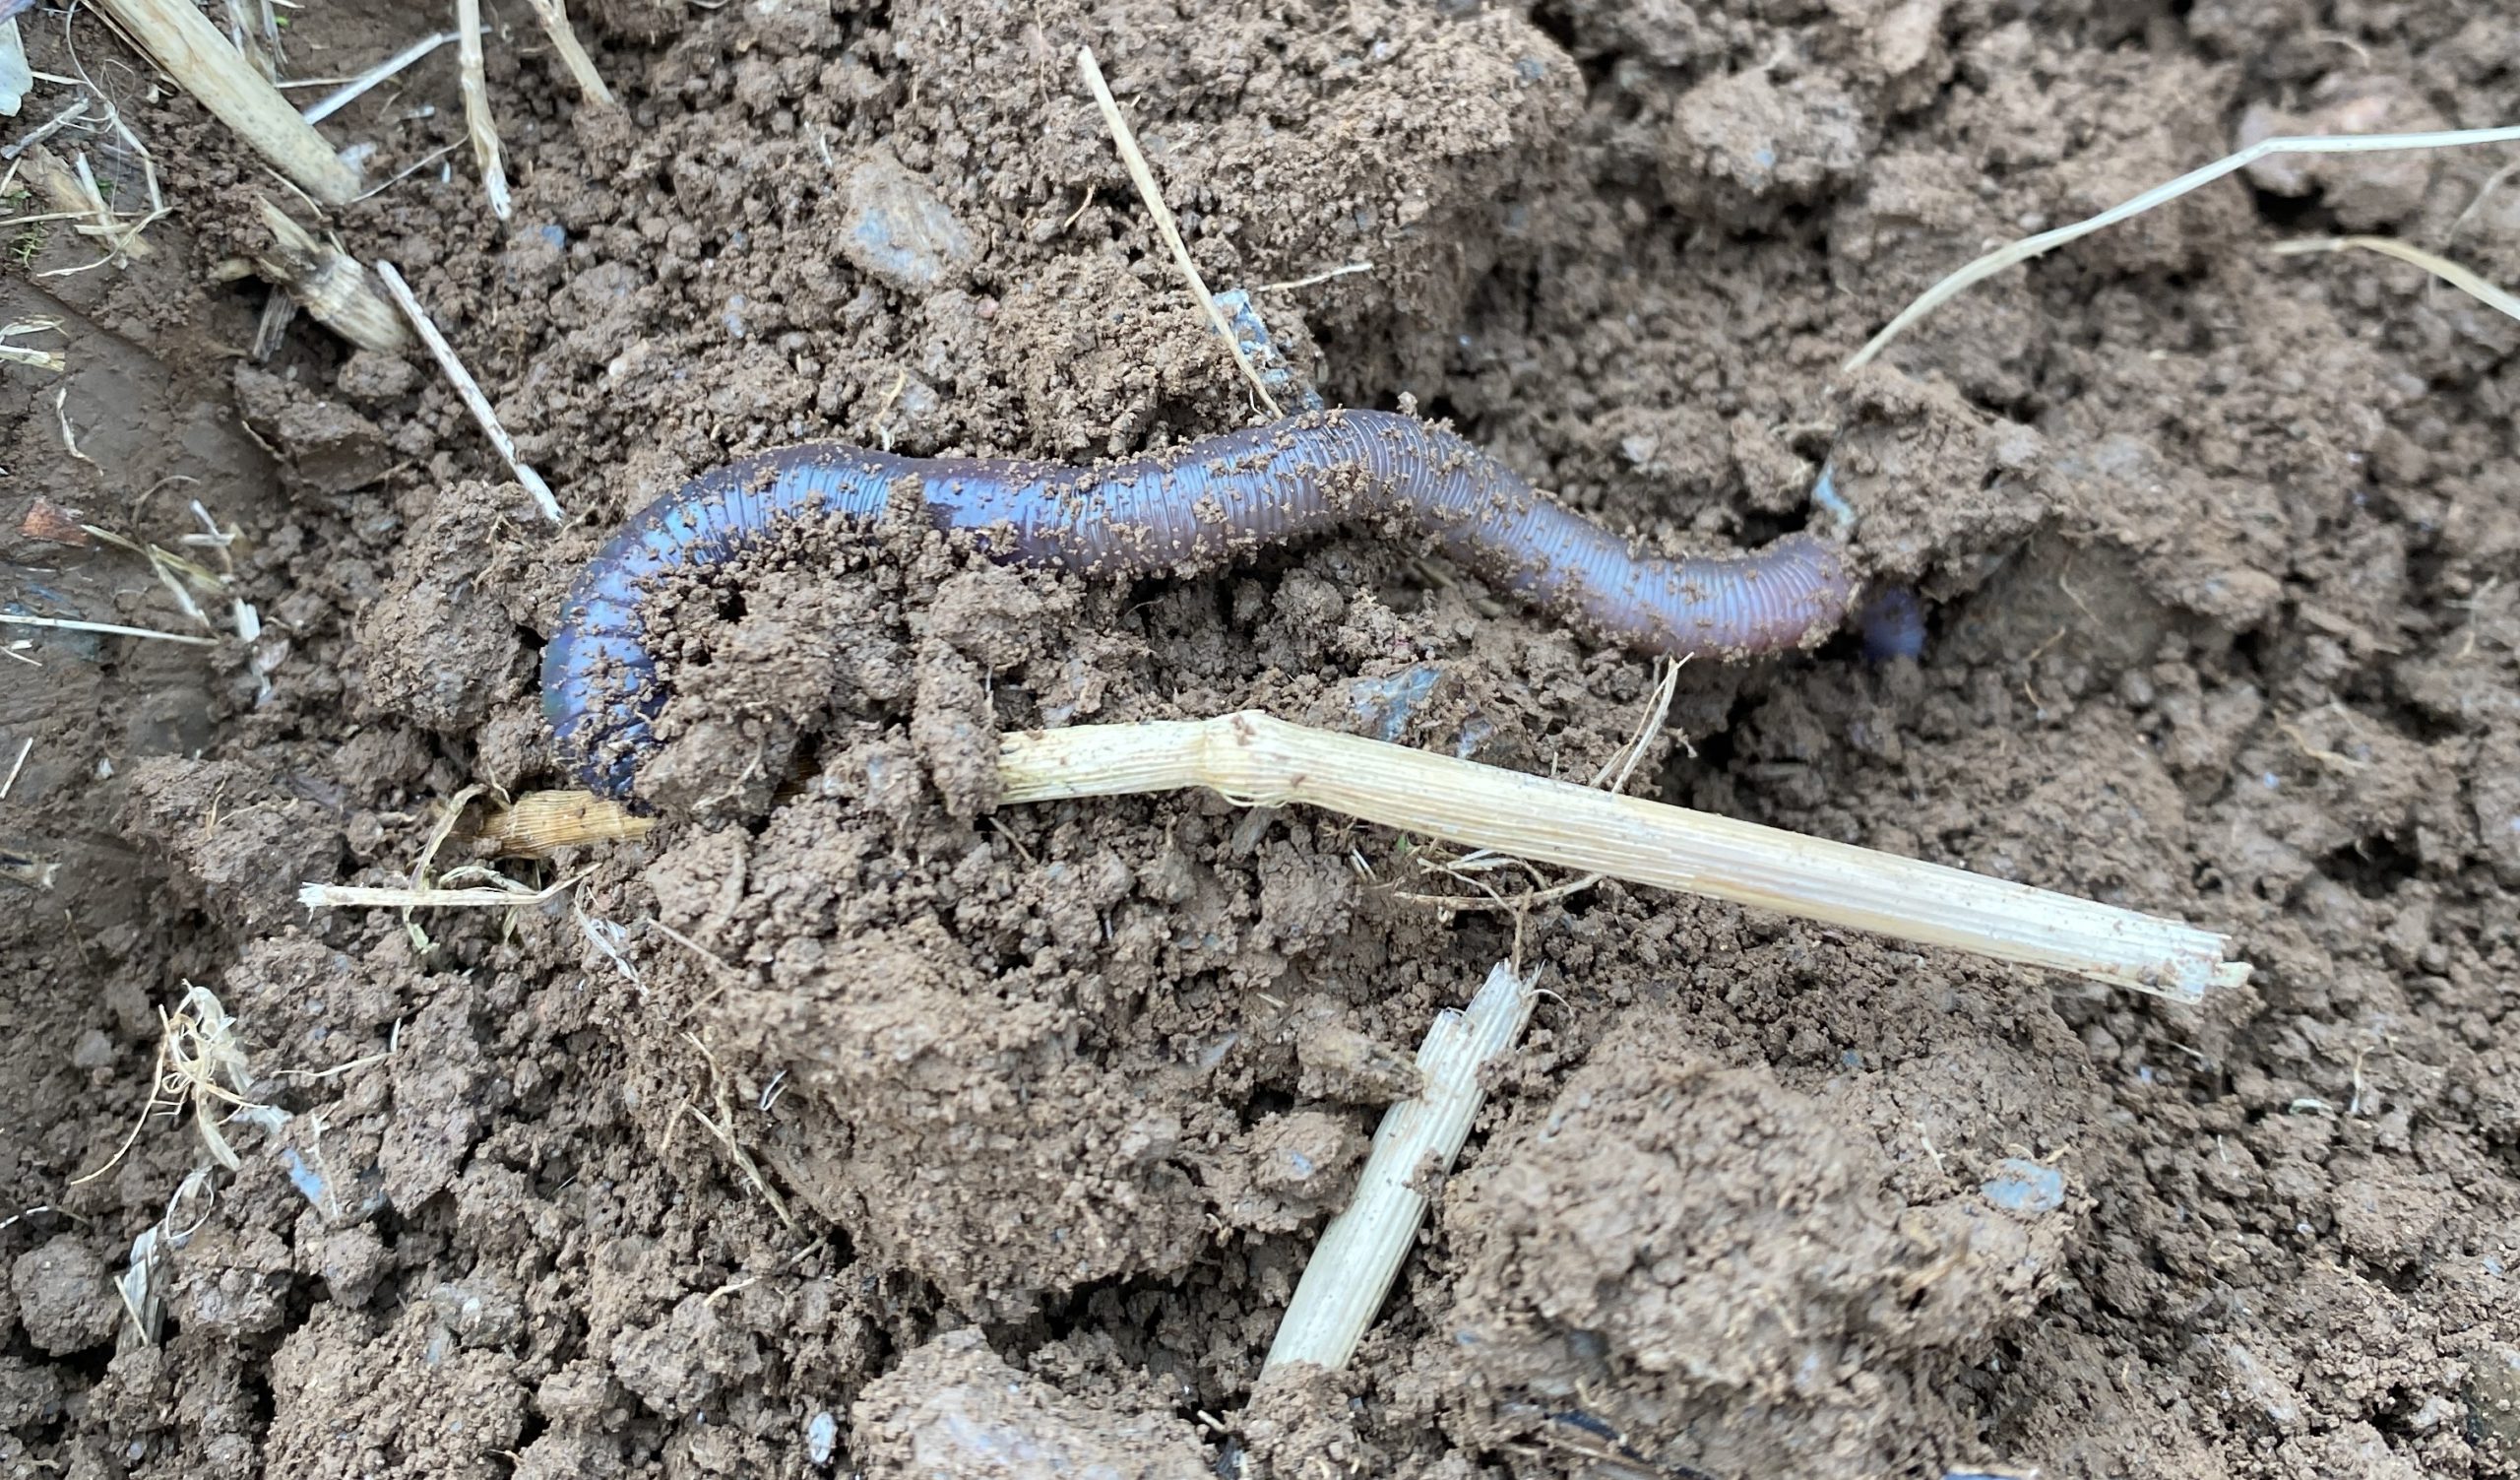
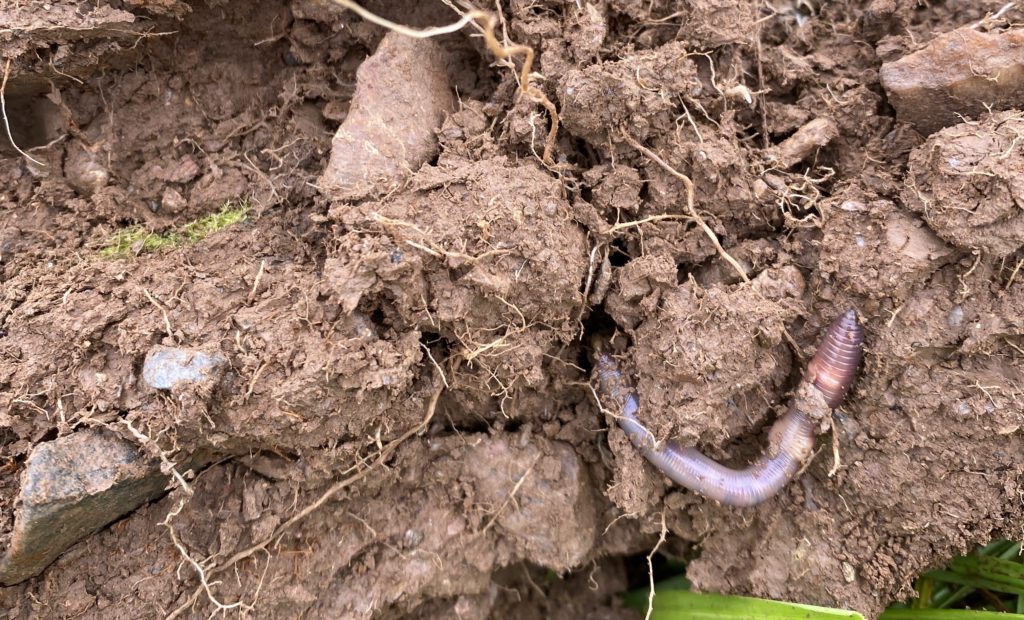
Becky brought us around the freshly dug soil pit to demonstrate the levels of compaction that occur at different depths. Highlighting the importance of less dense, yet stable soil in the top layer so that root growth of grasses and herbal leys are not hindered by increased soil density. It was pointed out that Billy Lewis’s mob grazing style was contributing to the meadow’s low soil density and therefore thriving grass system. As the stock is moved frequently, there is little time to compact the soil by trampling. Becky also highlighted the importance of earthworms for soil health. Earthworms are a key indicator of good soil health as they provide a multitude of benefits. Their burrowing increases spaces within the top layers of the soil which allow in water and air which promotes root growth for pastures through reduced compaction. Additionally, as Becky mentioned, their powers of nutrient cycling cannot be understated. Earthworms feed on organic matter which is excreted into plant available nutrients, speeding up pasture growth.
After Becky’s talk on soil qualities Niels took over to discuss a few practical methods (without the use of fancy gadgets) farmers can use to assess their soil health. With only the use of a spade and an inspection of what’s going on below the grass you can tell a lot about the soil. Niels encouraged the guests to go out into their fields and start to collect samples. He demonstrated the method of collecting a core sample by inserting a spade to a depth of around 30 cm on three sides and used the last side as a hinge to lever up a block of soil to inspect. Once the sample was out of the ground, he highlighted the relative ease of which the soil broke up as well as pointing out the abundance of earthworms, noting that this isn’t the case for a lot of agricultural soils.
Neils showing the group the simple ways in which soil samples can be taken
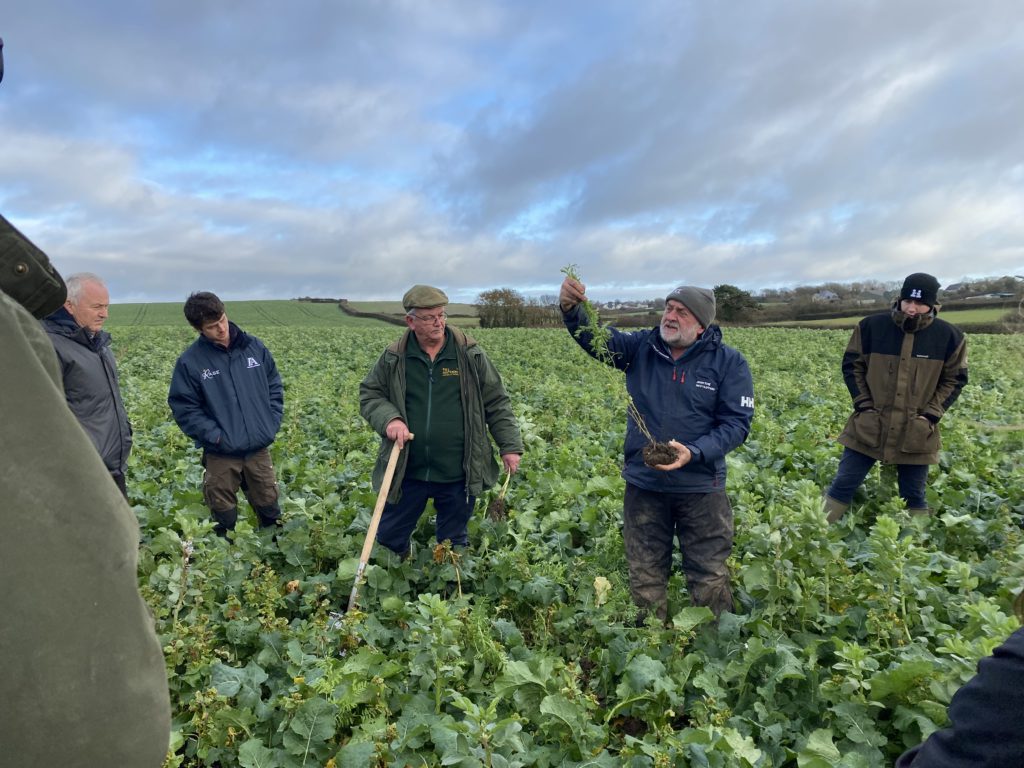
Livestock and mob grazing – chaired by Stefan Marks (FCT)
In this talk we heard from Tom Burge, an upland beef and sheep farmer, Billy Lewis, the host farmer, as well as Dan Smith, a farm manager running a commercial, net zero livestock farm alongside being a facilitator at the Herefordshire Rural Hub. They talked about their experiences with mob grazing, grass quality and the lessons they have learned experimenting with grazing systems.
Billy, Tom, and Dan discussing the benefits of mob grazing in front of one of his Hereford mob
In this session, Billy, Tom, and Dan discussed the benefits as well as the challenges involved with mob grazing while drawing on their shared experience of experimenting with this type of grazing system.
Tom Burge is a 4th generation farmer, owning an upland grazing farm in North Exmoor rearing over 1,000 Romney X ewes and 500 Scottish Blackface ewes. As well as 100 Angus suckler cows. After setting aside a 150 acre field trial with the aim of reducing fertiliser application, he began experimenting with mob grazing. He found that moving stock regularly (in his case every 2-3 days) and long resting periods resulted in improved grass quality and increased grass growth. All the panellists concurred that long resting periods for the grassland is crucial for increased grass quality and plant diversity which leads to more resilient grasslands.
In terms of economics, all the panellists agreed that the switch to mob grazing resulted in higher live weights and milk yields from their cattle and sheep. However, it was interesting to hear that these yield increases were marginal compared to the reduction in costs which resulted from the change of system. Dan found that within his new system, he could keep sheep outside all year round, including during lambing. He noticed that less bacterial infections and instances of pneumonia were occurring when he made these changes. Billy also noted the lack of fly related infections on his cattle on his mob grazing system which resulted in lower veterinary costs and better welfare. Although Billy still has periods through the winter where cattle are kept inside, these periods have reduced and therefore feed costs have decreased as a result. All the panellists concluded that optimising for a low input system was of great benefit to not only their pockets but the health of the stock as well.
An insightful question came from one of the listeners of the talk, who asked; how do you measure the changes in pasture performance? All three panellists admitted that they didn’t formally measure or record grass growth or quality of. Through anecdotal evidence and multiple decades of experience growing grass and farming on their respective farms they could see the difference in the quality of their grass which has translated into the quality of their stock and produce. Dan Smith added to this, highlighting that the preferred measure of performance is through financial gains, where all three of panellists have found a financial benefit.
A second question was fielded around the time consuming nature of mob grazing after Billy mentioned his rotations may only last 6-12 hours on some of his more intensely grazed meadows. He has found that frequent livestock movement isn’t as unmanageable as one might think. He proceeded to demonstrate the ease of which he can move electric fencing hexagonal fence posts (as seen in the picture below). These structures rotate along the ground as Billy moves the end of the fence, saving time by not having to take out every fence pole and place it in a different location in the field. Through experience, Billy often decides when to move his cattle by eye and knows that a system that incorporates flexibility works best for him. This certainly helps with the weather challenges that the three panellists agreed was a main limiting factor to their system. Droughts and periods of heavy rain (which were wonderfully demonstrated throughout the day) are challenges where flexibility is a crucial mitigator. Billy with his free moving electric fence pointed out that he can avoid waterlogged areas in order to protect the soil and grassland from trampling which is even more of a danger in wet conditions.
The easily movable electric fencing which saves Billy time when moving his stock
Arable/ Herbal Leys – chaired by Tilly Kimble-Wilde
We heard from Angus Gowthorpe (mixed farmer and Soil Farmer of the Year 2018 finalist), Edward Gent (Cambridge arable farmer who has been no-till for 16 years) and FCT’s Anthony Ellis (FCT farm carbon and soil advisor and mixed farmer). The talk focussed on their experiences with diversifying arable rotations, sometimes with herbal leys as well as their different approaches to grazing these areas.
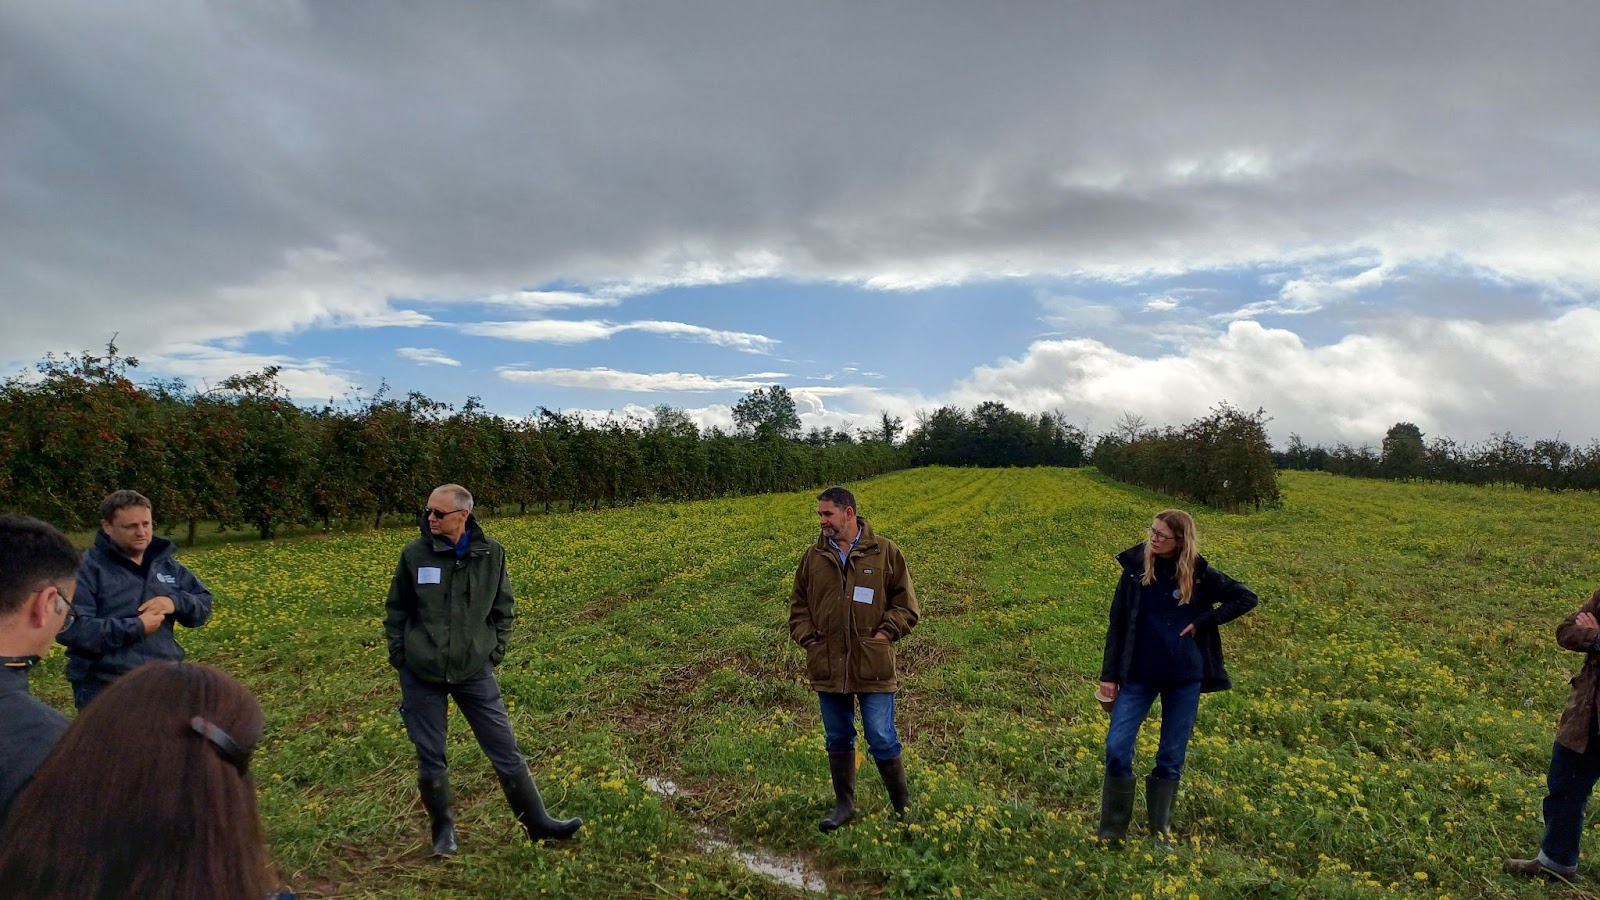
Panellists in one of Billy’s arable fields – note the agroforestry alleys in the background
Angus Gowthorpe, who manages a mixed farm in North Yorkshire, spoke about his transition from conventional to regenerative farming and how herbal leys have played a crucial role in this shift. By integrating a mix of species into his rotation, including deep-rooting herbs such as chicory and plantain, he has seen significant improvements in soil structure and organic matter. Angus highlighted how the diversity of plant species in the herbal leys helps build resilience in the system, reducing reliance on chemical inputs. He highlighted how grazing these leys with his cattle further stimulates root growth, enhancing the biology of the soil, contributing to a more productive and resilient farm ecosystem. The sentiments of this approach were echoed by both Edward and Anthony who had implemented similar systems.
Afternoon Sessions: The economic and climate impact of ‘regen’
Following lunch, we moved into a panel discussion Chaired by James Daniel with presentations from Anthony Ellis (FCT), Angus Gowthorpe, Tom Burge & Nick Down (Velcourt Farming Ltd).
James Daniel – Founder of Precision Grazing, whose primary objective is to optimise performance from pasture, James works across the UK helping farmers to implement and manage their grazing systems alongside ensuring family quality of life for farmers.
Angus Gowthorpe – mixed farmer and Soil Farmer of the Year 2018 finalist. Angus has been at the forefront of the regenerative transition in the UK and continues to push the envelope on what defines a sustainable farming system.
Tom Burge – Upland beef and sheep farmer whose move to a regenerative, grazing-based system has helped to eliminate inputs and transform the finances on his challenging Exmoor farm
Nick Down – Nick is the Head of Sustainability for Velcourt Ltd. Velcourt directly manages 57,000 hectares and provides advice in both the arable and dairy sectors across the UK. Nick oversees the farming operation of the Yattendon Estate in West Berkshire. The estate is going through a transition to a more sustainable farming system, incorporating more space for nature and enhancing carbon sequestration under an ambitious environmental delivery program. The farm is also a LEAF demonstration farm.
First each of the panel members presented an overview of their farming system, the regenerative practices they’ve employed and the subsequent improvements this has made to their business carbon footprint, resilience and profitability.
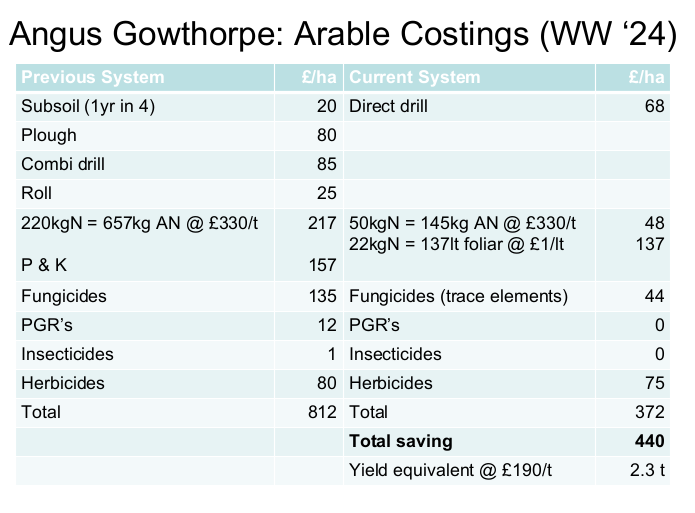
Angus sharing with us the financial benefits of his regen system
Angus shared with us a side by side comparison of his arable operations between his previous conventional system and his current low-input regen system for winter wheat production. From this slide it is obvious to see what financial benefits arise from converting to a regen system. Firstly, his in-field operations have reduced from four operations to only using direct drilling on his fields. This saves him a total of £142 per hectare. Additionally, a reduction of his fertiliser inputs saved his business £189 per hectare. Through soil analysis he found that his past applications of P and K were superfluous to crop requirements. He has also reduced reliance on fungicides and plant growth regulators by £103/ha. The reduction in inputs has given Angus an ability to withstand a lower yield without reduction in enterprise margin. At current prices he calculated that this was equivalent to around 2.3 tonnes/ ha or around a 30% reduction in yield.
A perspective of the greenhouse gas emissions reductions and financial benefits of regenerative agriculture from livestock farming came from Tom Burge who kindly shared his numbers before and after adopting his new farming strategy.
Tom Burge’s projections on how his emissions will change while continuing on his regenerative farming journey.
From starting his journey in 2017, he has eliminated use of fertiliser on his pastures, significantly reduced reliance on external feed and fuel, as well as reduced the number of hours of manhours worked on his farm. This has all translated into a steady reduction of on-farm emissions (expressed as kgCO2e per kg live weight of his stock). Due to implementing mob grazing strategies, pasture growth has increased by 0.9 tonnes of dry matter per hectare, displacing 36 tonnes of fertiliser and 72 tonnes of feed between 2017 and 2022. On top of the 1.66kgCO2e per kg of live weight, this has saved Tom’s business financially, to a tune of £24,000 per year. By 2022, Tom realised that the increasing cost of inputs outweighed the potential added value of his outputs, making these inputs un-economical to use.
Breakout workshops on field trials, weatherproof farming and composting
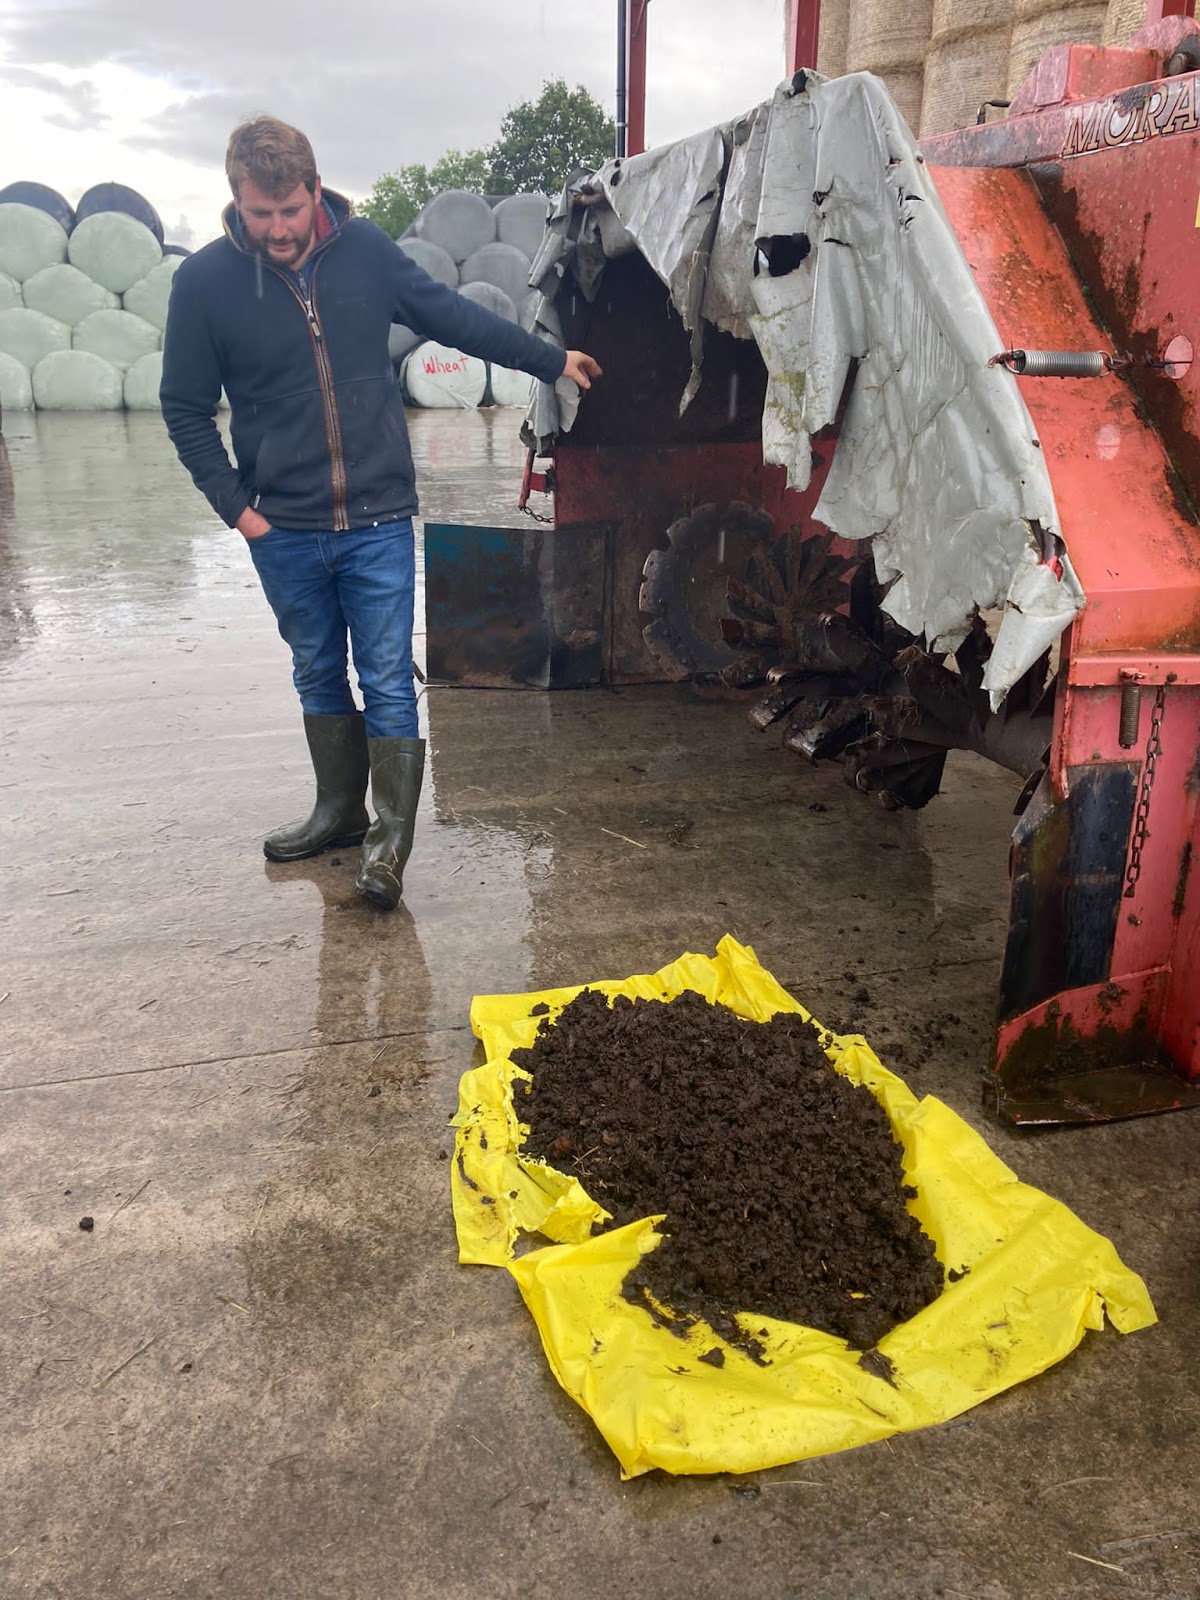
Billy showing the guests the resulting compost after he uses his windrow compost turner
Composting: Billy Lewis
Billy Lewis showed us his farm-yard manure composting process. After buying a windrow compost turner second hand, Billy is able to easily turn the compost pile to aerate it. Ensuring good air flow is key to creating compost, as aerobic microorganisms feed on the organic components and convert them into a nutrient rich soil amendment. Composts are much more stable than farm yard manures, providing a more consistent and slow release of nutrients, therefore, benefitting soil health in the longer term. This slow release enhances soil health and pasture growth by reducing the amount of leaching and volatilisation that occurs. Billy explained how he adds different components to his compost depending on what is available, such as wood chips and apple peel from a nearby orchard.
Research Trials: Hannah Jones
Hannah Jones (Senior Soil and Carbon Advisor with FCT) led an insightful discussion on effectively planning and conducting field trials in a scientifically robust yet practical way. She began by explaining the essentials of multi-year farm trials, covering aspects like choosing crop options for trial strips, combining various tests within one field, and structuring controls to minimise the effects of natural variations on trial results.
A major focus was on understanding how different factors can influence outcomes and the importance of controls. For instance, in a trial introducing beans into crop rotation, it’s crucial to have both fertilised and unfertilised areas to determine if observed benefits are due to the nitrogen contribution from beans, the fertiliser itself, or just field characteristics. In livestock research, increasing population size reduces the impact of natural variation (e.g. individual susceptibility to disease), thereby making the data more statistically reliable. Randomly assigning animals to control and trial groups is also key, as it prevents biases that could affect outcomes; for example, having the first ewes going through the hurdle enter one field and the latter half go into another could unintentionally separate the flock by skittish and lazy animals, skewing results because they have different temperaments.
Hannah also shared ideas and trials setups which some of the attending farmers were considering. The conversation highlighted the value of data sharing—each farm is unique, but insights from one trial can benefit many. By participating in groups like the Innovate funded Nitrogen Climate Smart agriculture (NCS) project, farmers can connect, share findings, and collaborate on new practices. FCT advisors are available to help with planning and can connect participants with like-minded farmers to optimise trial efforts.
Weatherproof Farming: Niels Corfield
Niels delivered a presentation which demonstrated to us the importance of improving soil health for sustainable farming. Niels Corfield is a farm advisor interested in regenerative farms and landscapes.
He shared video examples of how compacted soils, often mistakenly thought to be saturated due to standing water, were actually preventing deeper water infiltration and leaving dry soil underneath. Healthy soil, with proper porosity, was shown to allow water to penetrate, “banking” moisture for dry periods, which is crucial for crop resilience in hot summers.
Niels made a case for weatherproofing farms to both rain and drought through a mixture of practices including soil management, mechanical interventions e.g sub soiling, mineral, and biological interventions. We looked at some of these in detail. A key takeaway was that root health is central to improving soil structure, and managing grazing or cropping practices to encourage root mass and density is a fundamental part of improving soil resilience and health.
The evidence presented showed that a move away from set stocking and changes in pasture management was able to extend grazing seasons, reduce the need for winter housing, and boost grass production. Data from various drought years showed how drought severely impacted grass growth across the UK. However, farms with better-managed soil saw increased productivity due to better water retention, emphasising the benefits of improving soil structure and retaining water during wet seasons for use during dry spells.
We were left with the idea that land provides honest feedback which can be seen and acted upon: It reveals the effectiveness of farming practices through direct observation and we were encouraged to inspect the land regularly ourselves in real-time with a range of tests, rather than solely relying on lab results.
Carbon Farmer of the Year 2024
This very interesting and insightful field day concluded with the presentation of carbon farmer of the year. It is the second year of the competition and is awarded to a farmer who is engaged with and passionate about reducing their business’s climate impact. The award focuses not only on changing management practices to reduce greenhouse gas emissions but also on understanding and enhancing carbon storage in farmland. We were delighted to be joined by the three finalists. Andrew Brewer was awarded the Carbon Farmer of the Year Award for 2024, presented by Steve Dunkley, our sponsor from HSBC Agriculture (seen in the picture below). Andrew is part of the Farm Net Zero project and low GHG farming has been a top priority for him and his farm for a number of years. He manages 500 Jersey X dairy cows across his 400 Ha farm in Fraddon, Cornwall. He stood out to the judges for his understanding and application of a range of practices to enable his pasture-based dairy farm to remove atmospheric carbon into soil, trees, and hedges, while simultaneously minimising farm GHG emissions by focusing on maximising forage intake for his dairy cows and minimising inclusion of supplementary concentrate feeds. Andrew also selectively breeds his cows to work well within his pasture-based system. There is an opportunity to tour his farm during a farm walk he is hosting on November 8th.
Carbon Farmer of the Year 2024 Winner Andrew Brewer, Ennis Barton (right) presented by Steve Dunkley, HSBC UK Agriculture (Left)
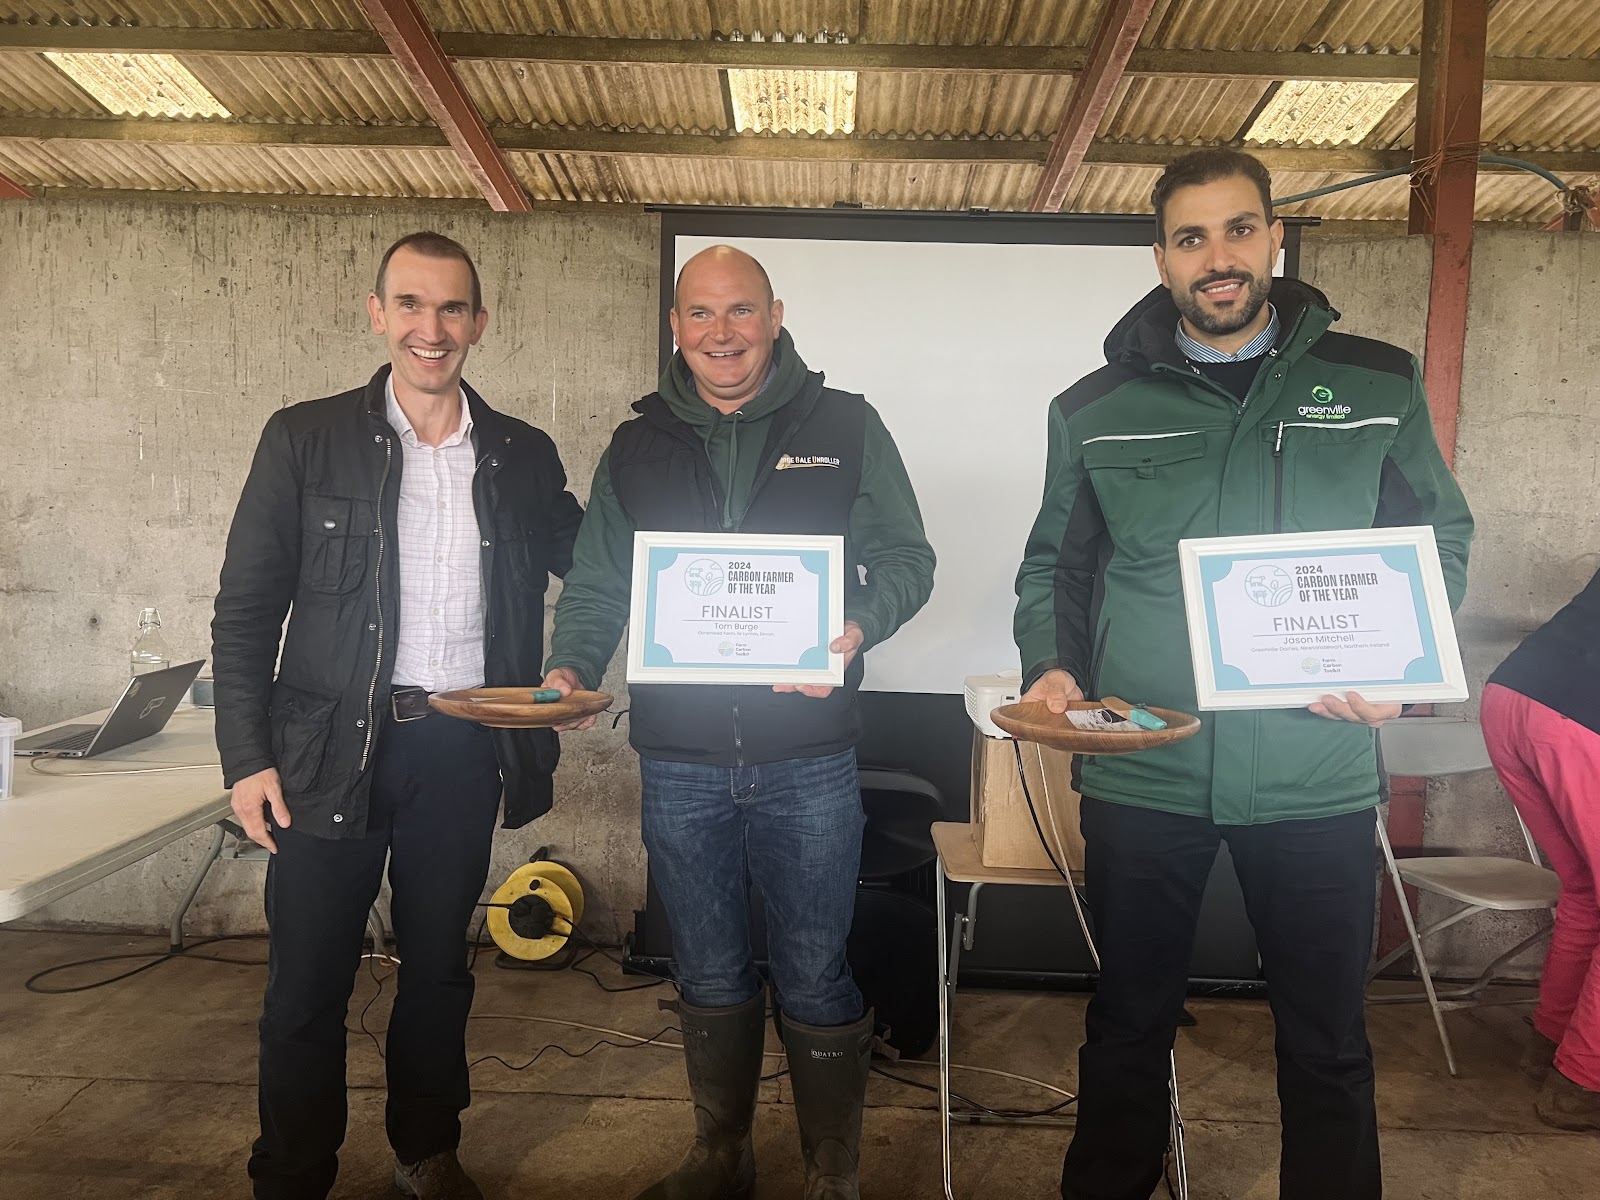
The other two finalists, Tom Burge and Jason Mitchell were praised for their continued efforts to mitigate greenhouse gas emissions in their businesses. The finalists awards were presented by David Cope, Head of sustainability at the Duchy of Cornwall who was also on the panel of judges (seen below). Tom Burge, who featured in the mob grazing workshop has done fantastic work cultivating a low input grazing system which has seen vast improvements in his grass quality and sequestration potential.
Similarly, Jason Mitchell is a Director of Greenville Dairies Ltd based in Newton Stewart, Northern Ireland. He has also been recognised for his continued effort to farm in a low carbon management system. At Greenville Dairies they have reduced emissions from their 850 strong dairy herd, largely through the application of genomics leading to greater feed efficiency alongside the development of a significant Anaerobic Digestion facility which sees them now taking in food waste alongside utilisation of cow manure to produce electricity, liquid natural gas (LNG) and digestate. Electricity and LNG are sold to the grid and to Companies such as Lakeland Dairies (their customer for their milk).
Carbon Farmer of the Year 2024 Finalists Tom Burge (middle), Adel Tajouri representing Greenville Dairies (right), presented by David Cope (left)
Dairy is often in the spotlight in terms of its environmental impact. Whether it be focussed on slurry management, methane emissions from animals, or soil loss and run off from maize crops, dairy is often an easy target. However, there are numerous farmers and projects who are showcasing that this doesn’t need to be the case, and there are positive steps that can be taken.
When approaching Groundswell this year, it was one of the things that we wanted to highlight. We are very lucky to work with some really forward-thinking organisations and farmers that we wanted to highlight at this national event. So we submitted our session “Can Milk be green?” to try and understand some key questions.
These were:
How do we quantify the importance of regenerative dairy systems when the current metrics are solely focused on reducing emissions intensity/litre?
How do we accurately represent the contribution that regenerative dairy systems are providing to carbon sequestration, biodiversity and resilient landscapes?
How do we do this in a cost-effective way which provides reassurance to processors and consumers that milk can be green?
How do we support farmers in that transition?
We had a fantastic panel of speakers which included farmers who were making changes and processors who were supporting both data collection, evidence building and industry communication.
Tom White from Yeo Valley introduced the session and highlighted the ability for grass-based dairy systems to deliver on a wide range of environmental benefits. The key areas of importance were around how we gather good data, collaborate and support our farmers to be able to deliver the changes on-farm. Tom focussed on the importance of diversity, including diversity in our pastures, rotations and management systems to deliver on a range of environmental impacts.
Andrew Brewer from Ennis Barton farm in Cornwall provided some insights into the trials that he has been involved with on his farm as part of the Farm Net Zero project. Trialling herbal leys and their impact on cow health and rumination, soil recovery after potatoes and cover crops have all provided useful tools to build soil heath and reduce emissions.
Will Mayor from Yeo Valley farms spoke about how by using their experiences with the beef animals they have adapted a system that works for their dairy cows. Implementing next-level grazing has allowed them to increase covers, remove the topper from the system and maintain milk quality and pasture utilisation, alongside soil health and carbon sequestration.
Lucy Noad from Woodhouse Farms shared her story in terms of her transition from a more conventional dairy farm over the last few years. Lucy spoke about the need to support farmers in the transition and also to ensure that the way we communicate engages farmers to understand the relevance of practical solutions for them.
Mark Brooking from First Milk concluded the session highlighting some of the ways that First Milk are supporting their farmers to make the transition to more regenerative practices. Farmers are supported through incentives to implement rotational grazing, species diversity and minimal cultivation in order to demonstrate an uplift in soil health, sequestration, biodiversity and water quality. Data is being collected on the impact of these changes to provide confidence in the potential for their members to deliver solutions.
It was an inspiring session which provided real life examples that show the positive steps that are taking place to provide data, collaborate and support farmers. Although our soil project with Yeo Valley is in the interim years before we retest soils, it was great to hear some of the practices taking place and the production and resilience benefits that the farmers are seeing now irrespective of soil carbon sequestration.
So can milk be green? The answer was a resounding yes!
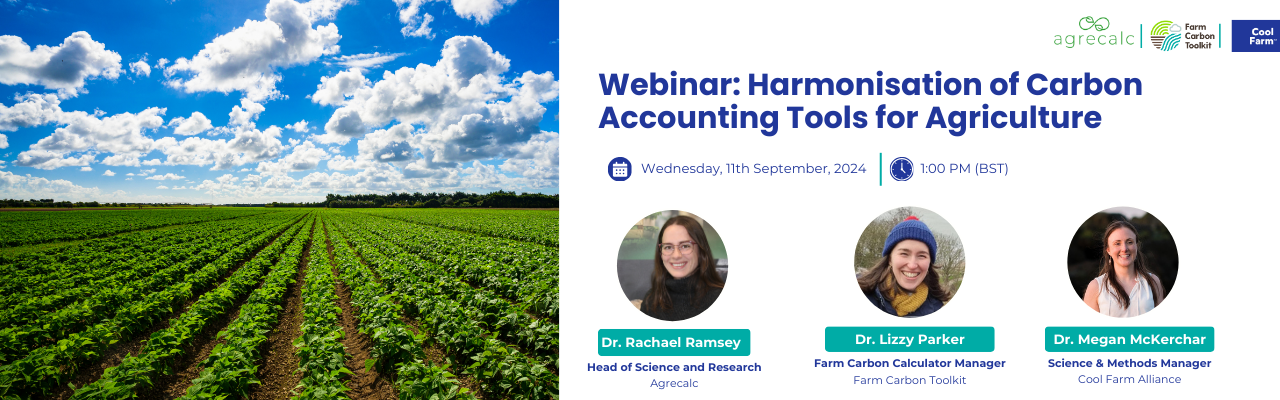
Watch a replay of this webinar held on the 11th September 2024 where representatives of the three major farm carbon calculators shared more details of the work they are doing together: Work to support UK agriculture to measure GHG emissions using the most up-to-date and accurate tools possible, harmonising the methodologies and outputs of their carbon calculation tools.
We received a great list of questions during the webinar event and teams from the various calculators will look to address those queries in due course.
The three major farm carbon calculators featured in the Defra Report Harmonisation of Carbon Accounting Tools for Agriculture – SCF0129 have announced a collaboration by signing a Memorandum of Understanding (MOU), intended to harmonise the methodologies used in calculating the greenhouse gas (GHG) emissions from agriculture.
The three companies are looking forward to their joint work on this major challenge, to fulfil the requirements outlined in the comprehensive Report, compiled by ADAS throughout 2023. It is generally agreed that the overarching goal should be to reduce the overall greenhouse gas emissions from agriculture through resource efficiency improvements, optimising production practices and mitigating environmental impacts.
Liz Bowles, Farm Carbon Toolkit CEO, said:
We are not seeking to reach a point where all three calculators will produce the same answer for any given dataset. As the Defra report put it, “ there is no single ‘right’ answer”. Rather we are striving to make it possible for users to fully understand why different calculators produce different answers.
We plan to align with the Science-Based Targets initiative Forestry Land and Agriculture Guidance (SBTi FLAG) and draft Greenhouse Gas Protocol Land Sector Removals Guidance (GHGp LSRG) through our collaborative actions. This commitment underscores our dedication to maintaining high-quality standards and ensuring environmental sustainability in our operations, and in calculation outputs.
Scott Davies, Agrecalc CEO, said:
It is intended that we agree on a common set of data sources which all three calculators will use. All calculators can go beyond these baseline requirements, and all parties to this MOU will retain their commercial independence. We will also involve the relevant government and other organisations’ teams with our work plan as we develop it.
This collaborative approach supports a joint understanding of industry requirements and advancing consistency in our tools and methodologies. Our goal is collaboration with industry, trade bodies, and fellow calculator providers in the UK and internationally, so that we can actively contribute to the development of more consistent approaches to on-farm carbon calculation.
Richard Profit, Cool Farm Alliance CEO, said:
We are looking forward to this collaboration, as it will help align methodologies where that makes sense and that will especially allow us to look into new areas that require attention. How we then incorporate the new information in our calculators will vary from calculator to calculator as a result of our different base approaches.
We will also ensure that the tools include the latest and most robust scientific findings into their frameworks and roadmaps.
The calculators are seeking that this joint work become the “agreed way” and at some point, become a minimum required standard for all calculators to adopt. The companies will engage in consultations with Defra, Welsh Government, Scottish Government, and Northern Ireland Government to reach a practical and realistic form of ongoing validation of their harmonisation work.
Methodologies or other harmonisation solutions developed as a direct result of the MOU will be published transparently, or will otherwise be made available for others to use.
Although this MOU currently only involves the three major companies in this space, the group is open to other calculators joining the coalition so long as they publicly provide transparency in their Calculator methodologies.
We will be holding a joint webinar on the 11th September 2024 at 1pm – 2pm to share more details of the work we are doing together. Please register here if you would like to join us
Notes to Editors
Farm Carbon Toolkit is an independent, farmer-led Community Interest Company, supporting farmers to measure, understand and act on their greenhouse gas emissions, while improving their business resilience for the future.
The Farm Carbon Calculator uses the IPCC 2019 and UK GHG Inventory methodologies and is aligned with the GHG protocol agricultural guidance. Recent development has allowed us to provide greater interoperability with other data platforms through our Report Export API and Carbon Calculation Engine API. This represents a step-change in the industry’s ability to provide trustworthy carbon footprints with transparent methodologies on platforms where farmers already collect data, thus reducing the data inputting onus on farmers. This new functionality has been warmly welcomed by supply chain businesses who are now using our Calculation Engine to support their customers without need for further data entry.
The Farm Carbon Calculator is used across the UK and on four continents with global usage growing at around 20% per year.
For over a decade, Farm Carbon Toolkit has delivered a range of practical projects, tools and services that have inspired real action on the ground. Organisations they work with include the Duchy of Cornwall, First Milk, Tesco, Yeo Valley and WWF. The Farm Carbon Calculator is a leading on-farm carbon audit tool, used by over 8,000 farmers in the UK and beyond. To find out more visit www.farmcarbontoolkit.org.uk
Agrecalc, a carbon footprint tool developed by combining practical expertise with world-class agricultural science, is a precise instrument that offers both breadth and depth of on-farm and through-the-supply-chain calculations of GHG gas emissions.
Agrecalc is the largest source of collated farm benchmark data from thousands of farms, having been used as the designated tool to deliver carbon audits under various schemes since 2016. It is recognised as the preferred carbon calculator in many of the emerging government programmes.
With a mission to increase efficiency and business viability of food production, the scientists, consultants, and developers who work on Agrecalc, strive to constantly upgrade the calculator according to the most up-to-date available research results and recommendations.
Media contact: Aleksandra Stevanovic, Head of Marketing; ([email protected]; 07551 263 407)
Cool Farm Alliance Community Interest Companyis a science-led, not-for-profit membership organisation (community interest company) that owns, manages, and improves the Cool Farm Tool and cultivates the leadership network to advance regenerative agriculture at scale.
For over fifteen years, the Cool Farm Alliance has worked to put knowledge in the hands of farmers and empower the full supply chain to understand and support agro-ecological restoration by providing a respected, standardised calculation engine to measure and report on agriculture’s impact on the environment. The Cool Farm Tool has established widely endorsed, science-based metrics for water, climate, and biodiversity, supported in 17 languages and used in more than 150 countries around the world.
Cool Farm Alliance members share the need for a respected, consistent, standardised, independent calculation engine and have joined the Alliance to ensure the Cool Farm Tool meets this need, now and in the future. To find out more visit https://coolfarm.org/
University of Cumbria is offering their part-time short course ‘Upland Farming for Net Zero’ delivered in partnership with Farm Carbon Toolkit, across 5 weeks from 9th September 2024. The course will take place in Cumbria, with sessions at the University of Cumbria’s Ambleside Campus, at upland farms across the county, and online.
Participants will learn where and how greenhouse gases are emitted, captured and stored on an upland farm. Farm visits and theory sessions will enable a comparison of farming practices and land management options, with climate impact in mind. In-person workshops will build skills and confidence to enable each participant to complete a quantitative farm carbon audit and make practical recommendations for actions towards net zero emissions.
Up to 12 full bursaries, subject to eligibility, are offered by the Foundation for Common Land via their Our Upland Commons project, with details available here.
Farm Carbon Toolkit supported the development of this accredited course for farmers, advisors and new entrants and worked with the University of Cumbria to enable delivery of the course for the first time earlier this year, in Dartmoor. Comments from participants included:
It was really worthwhile and I’ve gained a lot of knowledge and practical skills from attending
Plenty of on-farm, real-world teaching and examples
Becky was a fantastic tutor- incredibly engaging and knowledgeable
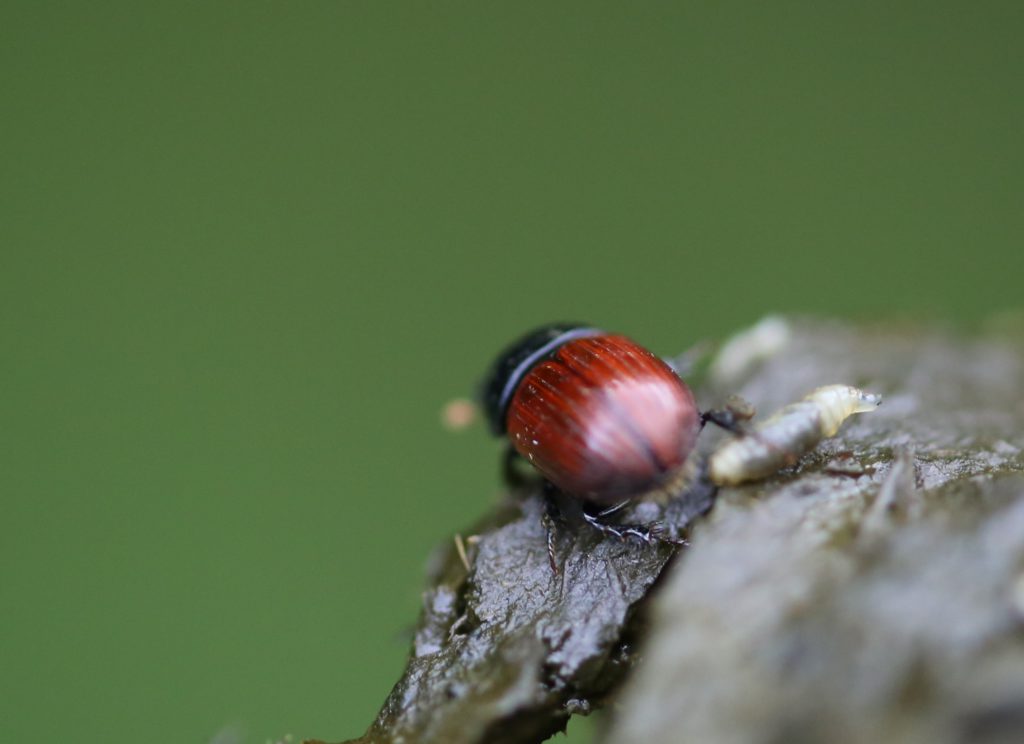
Dung beetles are fascinating creatures that play an essential role in breaking down dung, reducing greenhouse gas emissions and providing vital ecosystem services such as improving pastures, conditioning soils, and reducing parasitic burdens on our livestock.
What are the types of dung beetle?
There are three basic groups of dung beetles: dwellers, tunnellers, and rollers. Dwellers live and reproduce within the dung, tunnellers create channels underneath the dung pat pulling dung through the soil and storing within the tunnels to eat and lay their eggs, rollers roll dung balls away and bury them underground.
Where can you find dung beetles?
Dung beetles are found on every continent except Antarctica. Their habitats range from desert to farmland to forest, owing their entire existence to dung from an equally wide range of animals. You’ll find most dung beetles in or around dung pats from herbivores that typically pass undigested plant material as well as liquid. Adult dung beetles tend to feed on the more liquid portion of the dung pat and dung beetle larvae will feed on the more solid portion. Hence, it’s important for the animals depositing dung to have a diet containing lots of fibre.
Dung beetles in the UK
There are around 60 species of dung beetle in the UK belonging to the tunneller and dweller groups – rollers are found in the warmer climate of the southern hemisphere. Some dung beetles are active during the day whereas some fly at night. Just like humans, dung beetles have preference when it comes to sniffing out food (dung). Some prefer dung from specific animals, some prefer dried dung as opposed to fresh and some are even picky when it comes to the location of dung within a field, however, mostly are generalists and will reside in any they can find.
What are the benefits of dung beetles?
It has been suggested that dung beetles can save the cattle industry around £367 million a year.
How?
Firstly, they increase soil nutrients. Fresh dung contains nitrogen, potassium and phosphorous; dung beetles eat, bury, and release these nutrients for the benefit of the surrounding soil biology, improving soil fertility and soil structure through channelling and drawing down organic matter. This can reduce reliance on fertiliser and makes much better use of our manures.
Secondly, dung beetles reduce pasture fouling. When dung isn’t removed from the field, the grass underneath it will die and the grass surrounding it will be unpalatable to livestock. If you scale this up, it removes a huge area for grazing as well as wasting an abundance of nutrients.
Thirdly, dung beetles are excellent at reducing pest flies from the activities of mites which are transported on the beetles’ bodies. The value of these organisms can be identified through reduced parasites on your livestock that ultimately impact milk yield and liveweight gains due to energy expended by the livestock to defend themselves or fight against infection. In both cases, dung beetles reduce survival of flies and parasites through competition of resources.
Why are dung beetle populations in decline?
Unfortunately, despite the benefits of dung beetles, they are in decline due to the intensification of livestock systems – use of pesticides and anthelmintics. During the grazing season, dung pats could be broken down in a matter of days but instead, many lie rotting for a long time (and producing more methane emissions).
How can we encourage dung beetle populations?
Provision of dung is vital. If we’re able to outwinter even a fraction of our stock it provides a food resource all year round, attracting a more diverse array of dung beetle species.
Feeding livestock a more fibrous diet i.e. moving away from a grain-based diet can also help as it’s important to provide that partially undigested fibrous material.
Finally, long-acting anthelmintics can cause catastrophic loss of dung beetle populations. With veterinary support, frequent weighing of livestock and spot-treating animals offers a more sustainable way of reducing anthelmintic use, reducing the wormer-resistance in intestinal parasites, and protecting dung beetle populations.
How can we find out more about dung beetles?
There’s a wealth of information online about dung beetles, but to really get down to the detail, Farm Carbon Toolkit is holding a two-day conference, in partnership with leading vets, dairy cooperative First Milk and Somersetdairy company Yeo Valley, on Tuesday 11 and Wednesday 12 June at Yeo Valley’s Holt Farm near Blagdon, south of Bristol. Event details and registration can be found here
Written by Tilly Kimble-Wilde, Farm Carbon and Soil Advisor
Richard Anthony, of R & L Anthony near Bridgend, was awarded Second Place in the 2023 Soil Farmer of the Year competition. He was commended on how he responded to and managed challenges, never veering from thinking holistically, always upholding soil health as a priority, and treating each challenge as something from which to learn.
A majority arable business, Richard farms a 6-year rotation of wheat, maize, oilseed rape and westerwolds intermixed with a diverse array of cover and companion crops which he is passionate about. “The emphasis on farm is the soil, improving the soil and organic matter, and keeping a crop in the ground; keeping the soil biology alive.”
Richard and the team also strive to promote and create habitats for wildlife: planting wild bird seed mixes, establishing wildlife corridors, and bordering all hedgerows with a 3m margin to encourage growth year on year. 2m flower margins have also been implemented around all fields of oilseed rape which has been, to quote, “absolutely fantastic.” Encouraging insects and bees and getting the public on side too.
The farm walk itself took place on 23rd November 2023 and kicked off with a presentation taking us through the past year and outlining the various activities and obstacles the farm faced. We were then treated to a fantastic farm walk whereby Richard gave our group of visiting farmers, agronomists, and advisors a tour of some of what they get up to across their extensive arable and forage business.
A big part of what Richard and his team are trying to achieve across the farming business is to use very little bagged fertiliser. Most of the nutrients applied to the soil come from digestate, conveniently stored in the farm’s digestate lagoon. Tankers come in and fill alligator bags for easy transport and the digestate is spread on wheat, oilseed rape and maize.
So far, Richard has managed to eradicate artificial fertiliser when growing maize and OSR; however, wheat still receives a small amount of early application. This wouldn’t have been possible without the construction of the digestate lagoon, a project which was undertaken at the beginning of last year. Still, as Richard says, there is room for improvement. The farm is looking to reduce its N inputs even further by trialling an N inhibitor, all to build more resilience into the system.
This mindset has been applied to fungicides. To use less, Richard has changed the sprayer to accommodate the wet and windy weather brought in from the coast. Now at 250cm spacing, the booms can run very low resulting in no drift even if it’s windy. This enables more spray days and a better chance at getting the timeliness right.
As with most farms across the UK, the weather has been the biggest challenge with dry weather in May and June, and then rain as soon as harvest began.
Luckily, Richard had installed a biomass boiler 6-7 years ago for grain drying after a very wet harvest having heard about them in Scotland. It has been a game changer. Their 1-megawatt biomass boiler provides a lot more spare heat than previous methods of grain drying where they used up to 1.2 megawatts of gas on one drying floor. In the old system, if they were on 25% moisture, it took 10 days to dry one side. With the biomass boiler on woodchip, they can dry 2 drying bays, double the output, and never have to run the boiler flat out. With the right combine (Richard uses a MacDon belt header), the corn is cut as soon as it gets to 25% and achieves good output, as Richard emphasises “do not wait”.
Planting OSR in August was a struggle, with some fields too wet to put a tine in and any cultivation out of the question. Instead, Richard planted the wet parts of the field by snipping the OSR with a sprinter drill and planting the dry parts with a farm standard drill and a top down.
To better manage the unpredictable weather, Richard has a selection of drills that he’s held onto rather than sell. The farm will run 2, sometimes 3 drills if they can, capitalising on days when they have the right weather. This was especially helpful during autumn when the farm received 295mm of rain in October alone.
The farm also spends a lot of time on drainage. Ditches are cleaned, dug out, drains put in; all with the aim of evening out patches in fields and making the farm more resilient. As Richard says, it’s great getting 16t/ha on wheat in a bit of field but if you’re only getting 3t/ha in another part because it’s too wet there is space to do better.
Still, the most used bit of kit on the farm is a spade. By continually monitoring and assessing soil structure, Richard can make a well-informed decision when determining how to establish the next crop.
Farm Walk
During the farm walk, we were shown multiple cover crop and companion crop trials that were taking place on the farm. Steve Corbett from Agrii has worked with Richard for many years, trialling different varieties and combinations, highlighting the importance in being selective. You need good establishment, and it must earn its keep.
What they have found is that OSR, a “lazy rooting brassica”, completely lends itself to companion cropping, in this case with beans, spring vetch and buckwheat. Beans help to get the roots down as well as provide free nitrogen through nodulation. Spring vetch as opposed to winter vetch grows quickly providing biomass and N fixation. Buckwheat adds to the canopy, slowing down flea beetle, making it more difficult for pigeons to land, as well as mining phosphates. When the companion crops die, all the fixed nitrogen and phosphates will be released back into the soil ready for the next crop.
Richard deliberately plants OSR at low seed rates to encourage big branchy plants in spring which will grow away, allowing light through the canopy. By choosing thicker and well-branched OSR types, flea beetle is more contained, damaging only the outer leaves, leaving the middle to branch out. In Richard’s experience it provides a plant that will survive despite a pest living within it.
In terms of cultivation, Richard is a big fan of direct drilling. When direct drilling wheat, he believes it is important to see what is happening underground: what is the root depth? Taking stock of root depth and maintaining that attention to detail during crop growth is essential to determine the next steps in terms of cultivation. At Sealands farm, root depth is critical to survive the winds, Richard has found through monitoring that cultivation disrupts root growth, and that direct drilling fits his system best.
Ultimately, Richard has tried a lot which didn’t work out, but he’s kept at it. One outcome which has surprised him the most was the success of forage rye which he believes is underestimated. In the field, Richard showed us the root mass it was building and the excellent soil structure it yielded. This has provided Richard with an extra income stream, either taken for silage or grazed (ensuring to move stock on in wet conditions to avoid undoing all the good work he’s built up!).
Looking to improve the soil structure even further, Richard planted the forage rye together with westerwolds. He found that they were able to harvest the westerwolds a fortnight earlier due to the ability of the forage rye to get away in the spring creating its own microclimate which Richard believes benefitted the westerwolds.
Finally, we heard about Richard’s problem with persistent perennial ryegrass. In this instance, he introduced an annual ryegrass to outcompete the perennial. “Putting in a bully to outcompete a bully”. It worked and Richard is now able to include it within the arable rotation without generating a loss. This allows a rest period within the rotation to build fertility, stabilise soil structure and generate a bit of extra cash from silage or grazing. Essentially, Richard is maintaining the balance of farming resiliently: optimising soil health and crop yields while sustaining a viable business.
As we’ve all come to realise, we can’t rely on the weather, however, prioritising soil health as perfectly exemplified by Richard, can better equip us to respond and adapt. When we get to know our soils, monitoring how they behave in certain conditions and how they respond to our actions, we are better prepared and forearmed to make decisions that will affect future harvests and pocket.
Through trials and problem solving, Richard together with Steve have implemented more diversity and reduced inputs without damaging profits. A big resistance to straying from our well-known and “safe” rotations is often down to “how will it pay for itself”. Richard and Steve have shown that they’re not radical in their rationale for cover and companion crops, the bottom line is it has to pay. The most exciting take home from the day is they didn’t give up: they’ve found the right species to incorporate, the soil health on farm is improving and crop yields are directly benefiting. It was a truly inspiring day and a masterclass in perseverance. Richard hasn’t made it look easy by any stretch but as he puts it “we’re just learning all the time.”
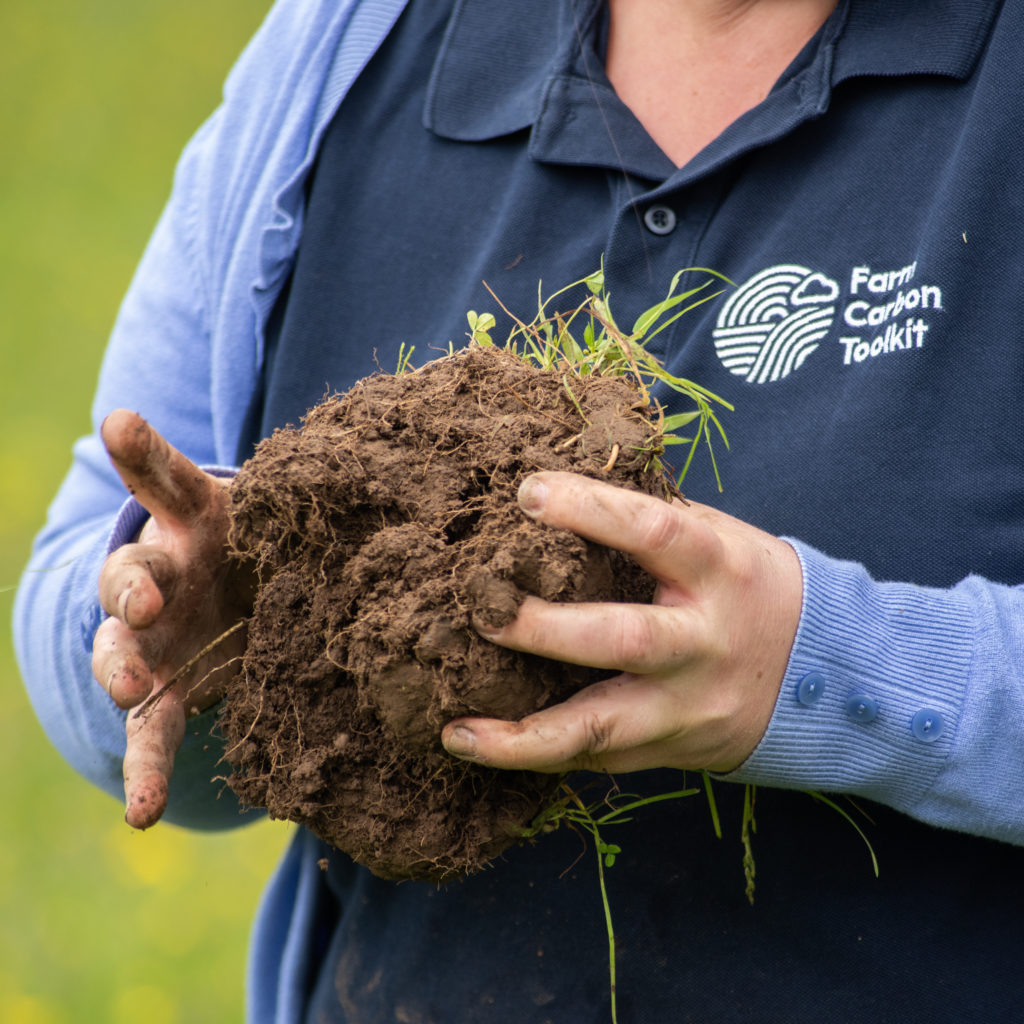
One gram of soil can contain one billion bacteria and up to 10,000 different species of bacteria with only 1% of organisms estimated to have been identified.
The soil functions as part of a vital living system which supports crop and animal health, underpinned by massively complex interactions between the biological, chemical, and physical properties of the soil. Life in the soil is often underestimated, spanning millions of species and billions of organisms which account for the highest concentration of biomass from anywhere on the planet. Fertility and crop performance are at risk of being distilled down to the chemical or physical constraints of the soil in isolation. This encourages an oversimplified approach to soil management. Sustainable Land Management, and the move towards regenerative agriculture encourages a more holistic management of the soil, resulting in enhanced biological diversity and so delivering the key benefits. It is important to recognize the importance of soil biology without overthinking its complexity, after all, we cannot manage for individual microbial species.
Soil Microorganisms
Soil microorganisms describe both bacteria and fungi, whose abundance makes up much of the biological biomass in the soil. Bacteria and fungi produce a range of enzymes which can break down and absorb inorganic and organic matter which is later made readily available as nutrients to plant roots. Fungal communities form larger hyphae ‘networks’ which are beneficial in mobilising nutrients in mutualistic exchanges with rooting structures. These fungal hyphae can extend over great distances and further help with the aggregation of the soil, improving soil stability, water holding capacity and therefore a greater resilience to droughts and waterlogging.
Bacteria exudates form the ‘glues’ which facilitate the formation of microaggregates from soil particles and as well as increasing the cycling of nutrients with a particular focus on the nitrogen cycle. Both fungi and bacteria are responsible for the breakdown of organic matters within the soil profile and so populations benefit greatly from manure applications.
Due to their short life cycles, the population of these organisms may shift rapidly as a result of changes to their environment including the soil temperature, moisture and chemical composition. A healthier soil will generally have higher microbial biomass and will benefit from a larger fungal-to-bacterial ratio. Applications of agrochemicals and fertilisers can impact populations with overapplications of nitrogen promoting a more bacterially dominated soil. Likewise, tillage can break up the fungal hyphae which are more sensitive to physical disturbance.
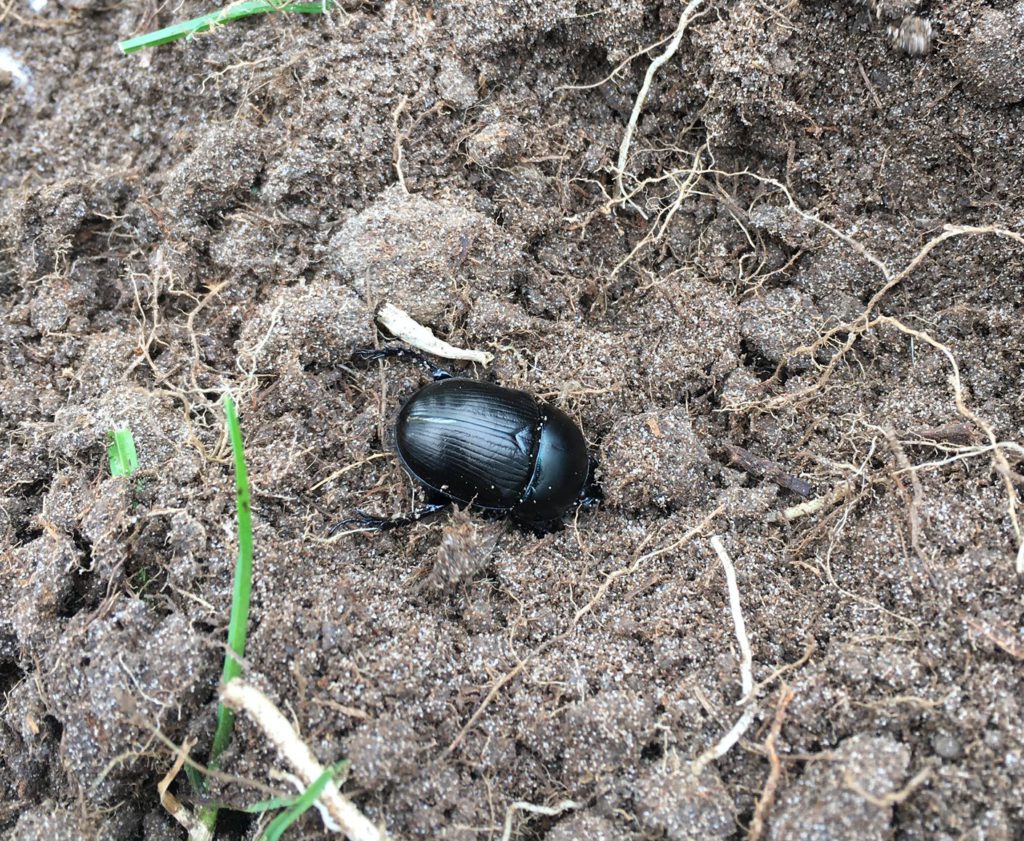
Soil Macrofauna
The macrofauna are larger organisms which inhabit the soil with perhaps the most notable being the earthworm. Not only do earthworms operate as ecosystem engineers to enhance the soil and provide a better environment for other plants and animals to reside but they are an excellent indicator of soil health. Whilst it can be difficult to measure soil biodiversity the presence of earthworms indicate, on a larger scale, a healthy operating food web with a distribution of organisms across all trophic levels. As such earthworm numbers have become a good metric for biological soil health which are a result of and have an impact upon the chemical and physical properties of the soil. Earthworms fulfill different functions based on their niche, with the three main groups being:
Epigeic – Inhabit litter layer and cycle carbon
Endogeic – Topsoil dwelling and enhance soil aggregation and nutrient mobilisation
Anecic – Deep burrowing improving porosity, water infiltration and root development
Considerations for Biological Soils
Feed the soil: amendments of organic matter will benefit soil organisms as it provides a feed source for them to thrive on. Conversely the greater the soil fauna populations the quicker and more available the nutrients. Over applications of inorganic fertility sources can have a negative impact causing the soil to become too bacterially dominated.
Crop diversity: the greater the crop diversity the greater the diversity in below-ground populations as there is a greater range of plants to feed and interact with in the growing environment. This necessitates the implementation of more diverse crop rotations into arable systems and will benefit from greater diversity in grassland with the inclusion of legumes and herbs.
Reduced tillage: tillage can have an adverse effect on established populations of soil organisms from the fungal hyphae all the way up to the earthworms. A move towards less intensive tillage through the adoption of no-till or min-till establishment at suitable parts of the rotation will help to maintain soil biological populations.
Overall, the biological component of the soil should not be overlooked as it is an essential part of a vital, living soil. Allowing soil to function properly will bring a host of benefits which can result in real world cost savings. Chief among these benefits may be the increased resilience in a changing climate.
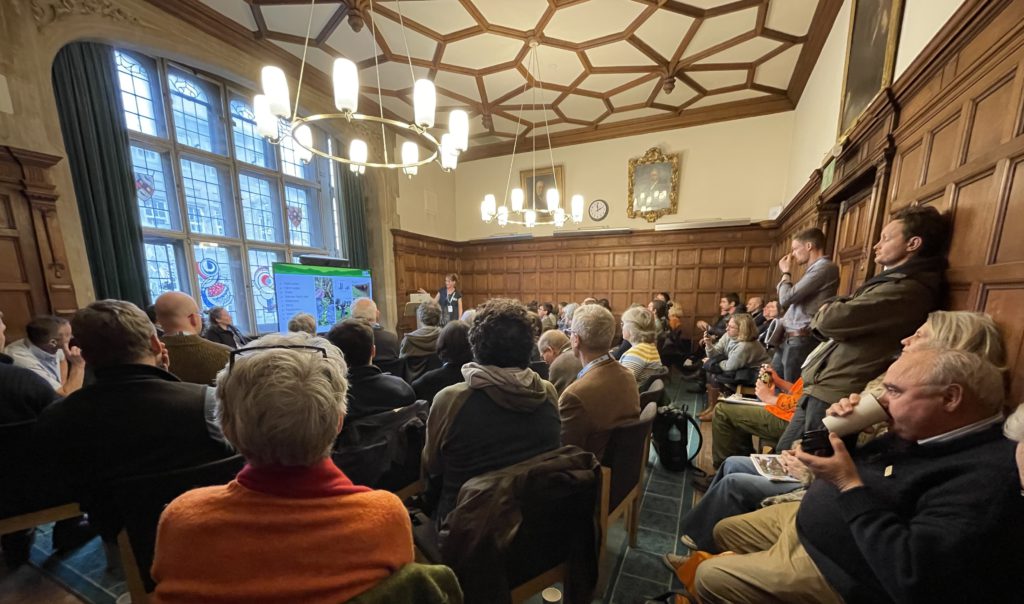
Welcome to our April Farm Net Zero newsletter, sharing updates for our farmers, growers and the wider community this project supports.
(Image above: Dr Hannah Jones/FCT presenting at the ORFC)
Recent news and events
Oxford Real Farming Conference: January 2024
An intrepid band of Farm Net Zero farmers and project staff made their way to Oxford for the Real Farming Conference where we were presenting a session called “It Takes a Farm Community to be Net Zero: A Case Study from Cornwall”. This was a sell-out, with people queuing to get in, and helped to demonstrate the excellent work the FNZ farmers are doing as part of their communities. The film we produced was well-received, even earning a “whoop” from the crowd! It is available to watch here: https://farmcarbontoolkit.org.uk/2024/01/18/five-farms-in-cornwall/.
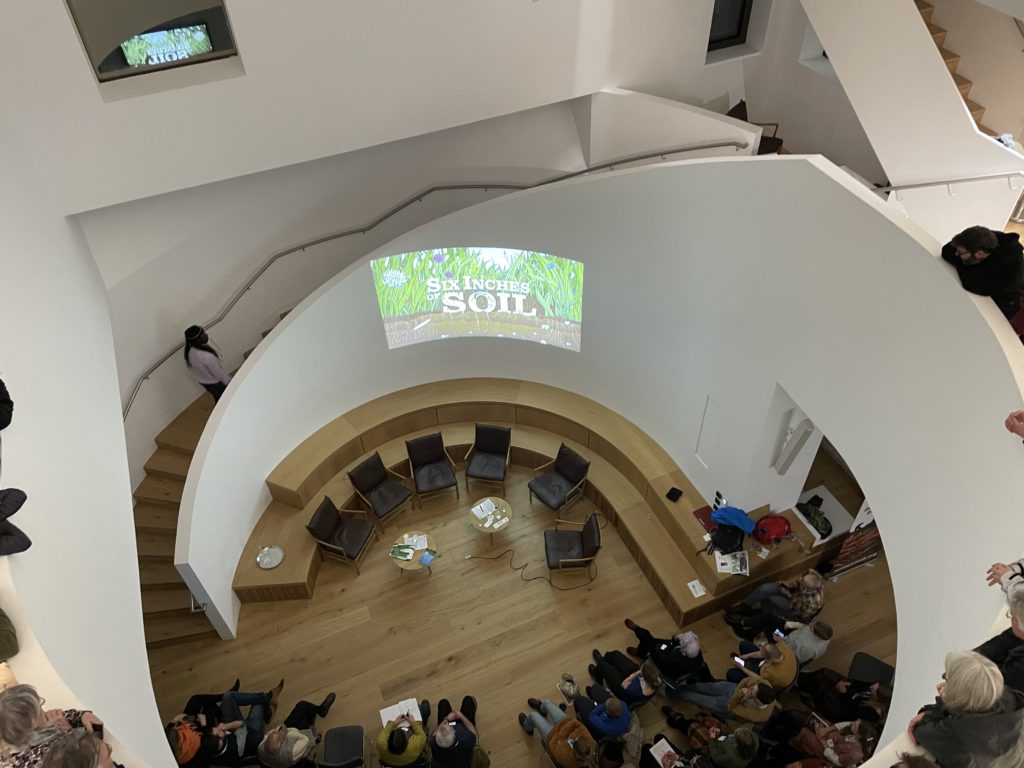
As well as the impressive range of sessions we were able to attend (covering everything from the role of vets in ecological sustainability to farm succession planning), we watched the premiere of “Six Inches of Soil” – a new film about farming starring Farm Net Zero monitor farmer Ben Thomas and featuring Farm Net Zero’s own Hannah Jones.
Premiere of “Six Inches of Soil”
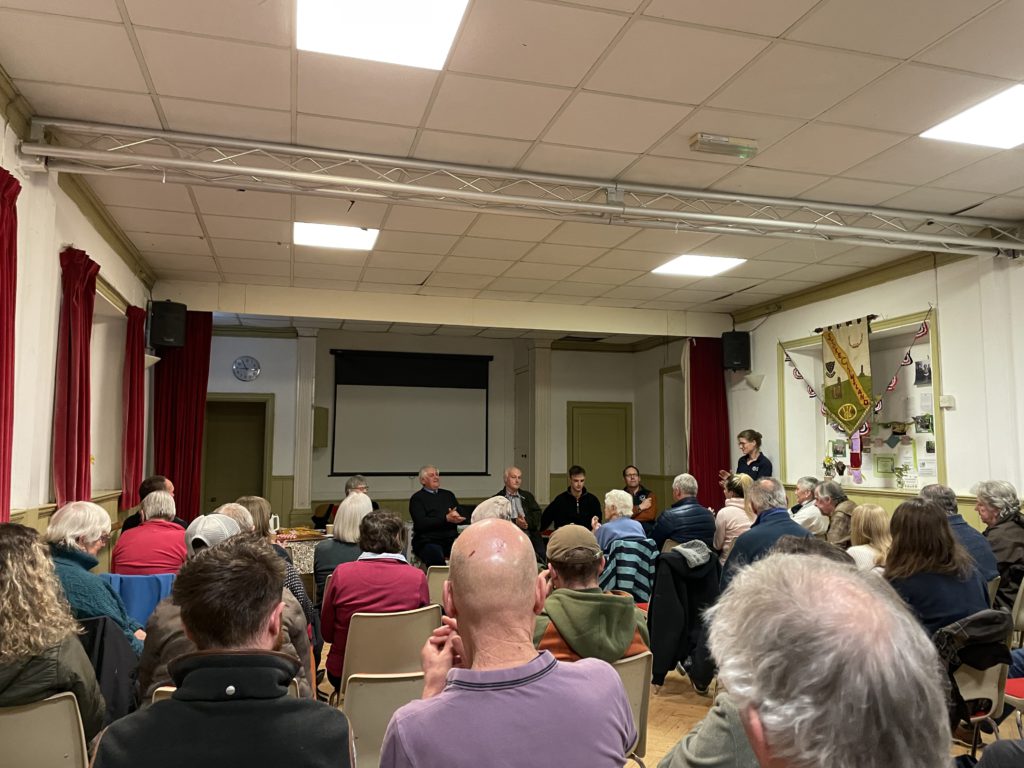
Community film screening 25th March
On Monday 25th March, we showed the Farm Net Zero Community Film at Stoke Climsland Parish Hall. This event was very well attended by members of the local community, drummed up by Bonny Lightfoot and Martin Howlett, FNZ monitor farmers and stars of the film. Following the screening, there was a panel session with the farmers where attendees were able to ask questions on climate change, biodiversity and how the project farmers are working together to address these issues.
We ended the session with the farmers’ visions of farming in the future, with all agreeing that there will be more of a mix and integration between farming and nature.
Community film screening
“Filming on Your Phone” Workshop
We ran our second “Filming on Your Phone” workshop with Down to Earth Media just before Christmas. This gave a group of farmers the opportunity to learn about how to share their stories and the good work they are doing. Since the start of the project, 12 farmers have now received media training.
“Filming on Your Phone” workshop – Sam Roberts of Blable Farm being filmed!
The success of Farm Net Zero has led to a short project funded through Cornwall Council’s Shared Prosperity Fund, to work with farms in Cornwall on carbon, biodiversity and water management plans. This project is a collaboration between the Rural Business School, Farm Carbon Toolkit, Westcountry Rivers Trust and Cornwall Wildlife Trust. If you are a farmer interested in taking part, please contact [email protected]
Falmouth Climate Change event
The Farm Net Zero team was present at the Climate Change Exhibition held at the Polytechnic (“the Poly”) in Falmouth on March 8th and 9th. The event, which was organised by Falmouth Rotary Club, was aimed at raising awareness amongst the general public. We were able to share some of our great work with passers-by, and as a result of our presence at the event, we have been asked to host a visit by two Cornish MPs this Spring.
Demo farm and field lab update
Inter-cropping cabbage
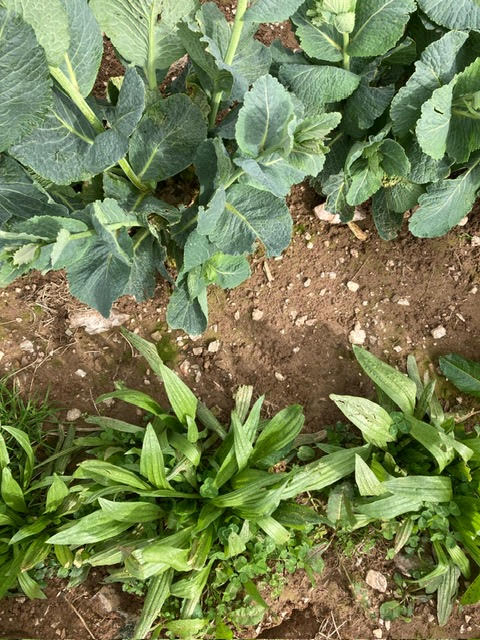
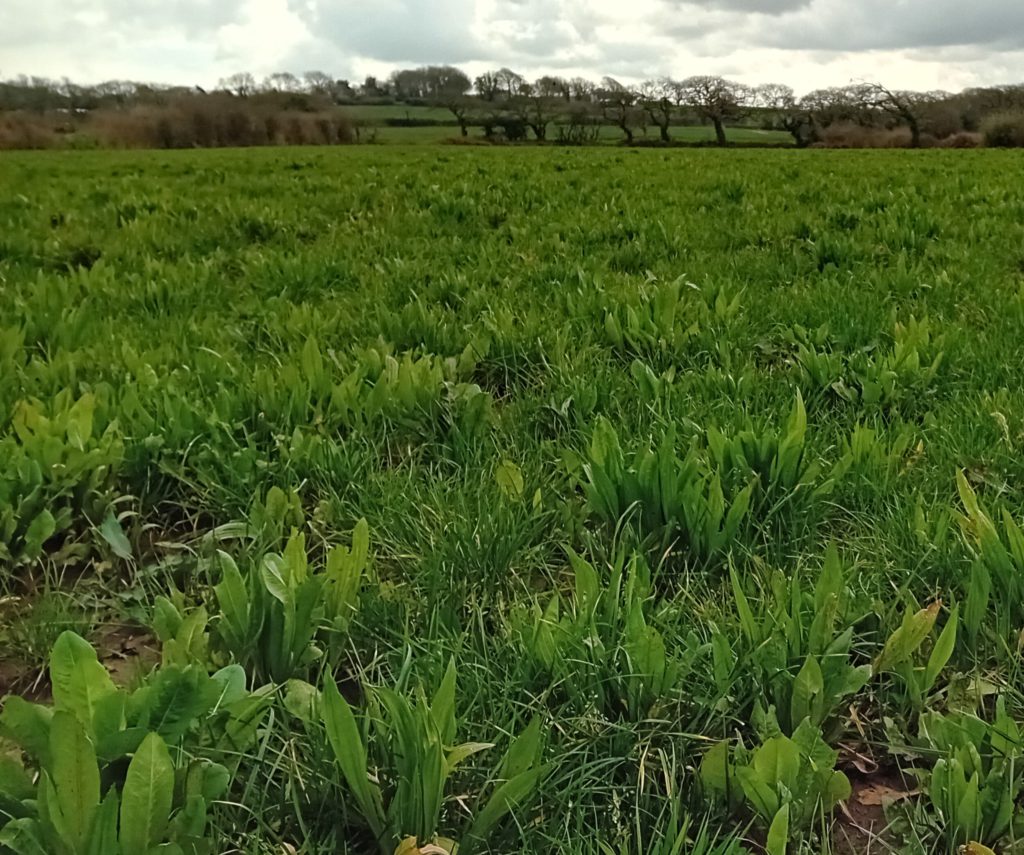
The inter-crop sampling for the cabbages has just been completed at Ennis Barton, one of our FNZ demo farms. This is a collaboration between Andrew Brewer and Andy Williams of Riviera Produce Ltd. Soil samples have been sent away for assessment of soil organic matter, but it is the impact on soil aggregate stability, and water infiltration that is of particular interest in this short term winter cover crop. A mix of buckwheat , phacelia, white clover, plantain and chicory was broadcast between cabbages in 4 blocks across 4 fields and compared to the control treatment of no cover crop. More data to follow.
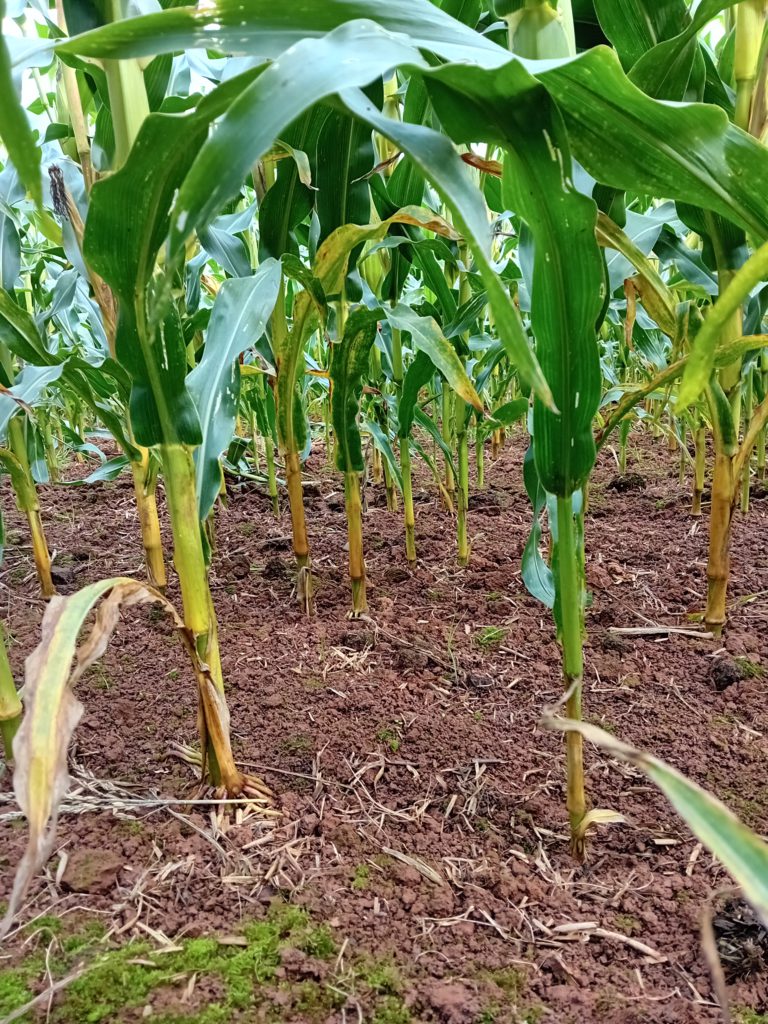
Winter cover crop between harvested Savoy cabbages ready for grazing until reseeding with grass in May.
Farm Net Zero maize trials
This is the second year of the FNZ – Innovative Farmers maize field lab. This trial is evaluating the effects of different establishment methods, such as strip till and under sowing, on maize yield and soil health. For example, at Duchy College the trial plans involve splitting a maize field between conventional establishment and reduced cultivation and then trialling undersown mixtures in the opposite direction across the field.
This year we have teamed up with Plymouth University who will be carrying out some more in-depth soil testing. If you’re interested in taking part in the trials please do get in touch: [email protected].
We have a meeting planned for the triallists and researchers on 3rd April near Bodmin.
Diverse covers and leys to reduce worm burden at weaning
Weaning shock in lambs can cause physiological stress and slow growth rates. But this effect could be offset by enhanced forage protein content.
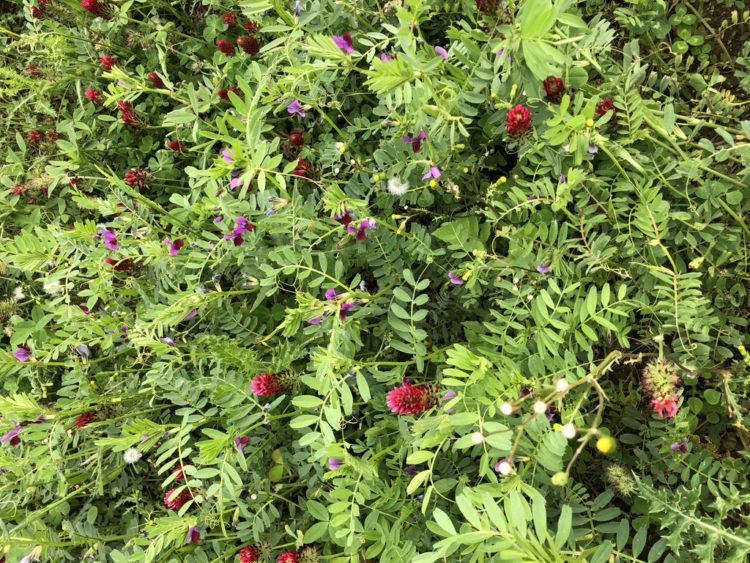
Two of our monitor farmers, Matt Smith and Anthony Ellis, have teamed up with the Farm Carbon Toolkit to launch a new Farm Net Zero trial, examining the effect of protein rich cover crops on lamb growth rates. This Innovative Farmers field lab will test a bespoke chicory-rich mixture for lamb weaning. The farmers hope it will improve growth rates, reduce lamb production footprint, improve soil health and lamb welfare, as well as reduce the need for wormers.
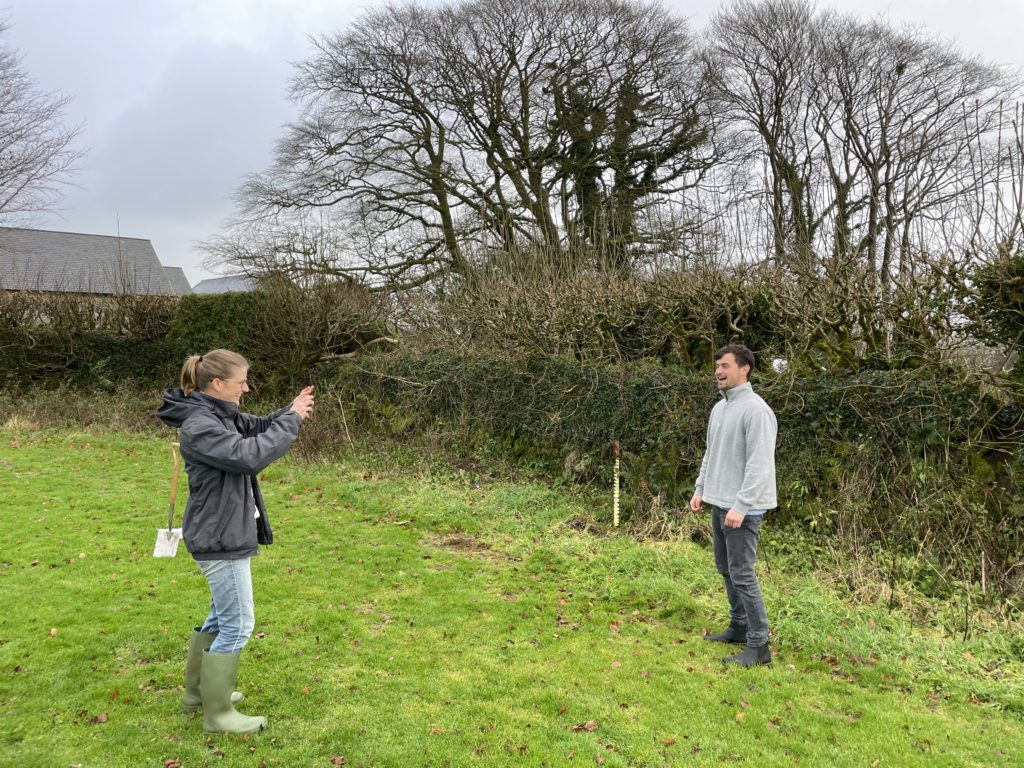
Andrew will split his dairy herd, grazing one group on standard ryegrass and clover leys, and the other on diverse swards/ herbal leys. Forage samples will be taken ahead of the cows moving in to graze. The milk yield and constituents from the trial cows will then be measured regularly throughout the 2024 growing season.
and Cornwall Wildlife Trust and will deal with the big question many dairy farmers want answered. Dr Daniel Enriquez Hidalgo of University of Bristol, has been leading the study design and will be carrying out the results analysis. We are grateful to Andrew for all the extra hard work the trial will involve.
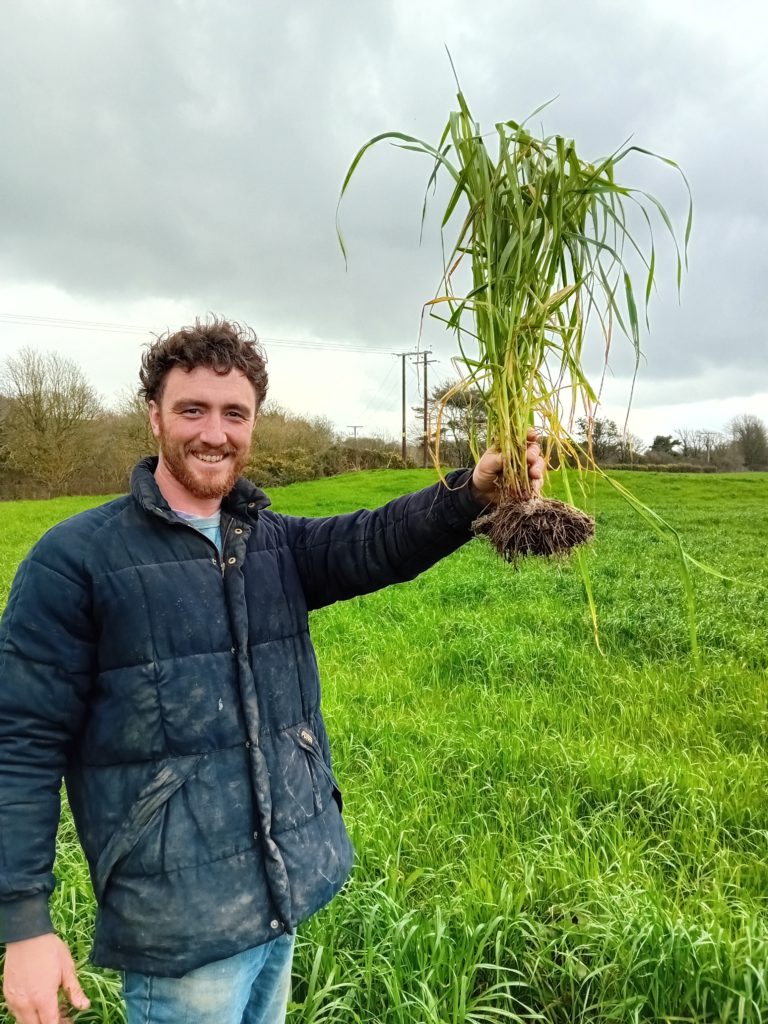
Conor Kendrew from Cornwall Wildlife Trust sampling forage at Ennis Barton farm
Dock Control Field Lab
Last years ‘How to rejuvenate pastures’ hosted by James Barrett has led to a new field lab. James rotaseeded a dock-infested grassland and destroyed docks just by addressing surface compaction.
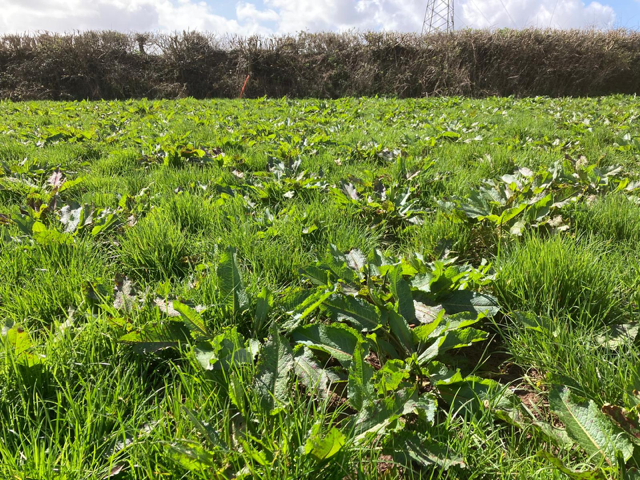
Dock infestation of pasture
Calcium levels were also found to be at good levels in the soil. The new field lab will be recruiting up to 10 farmers, a field each, to test out the impact of optimising soil structure through mechanical intervention and the use of granular and foliar calcium application. Please contact a member of the FNZ team if you would like to be involved.
What next?
Workshop “Gardening & Trees” – with FNZ & Nourish Kernow,
Sunday April 21st, 1:30pm – 4pm, Higher Culloden Farm, College Road, Camelford, PL32 9TL
Learn about the environmental benefits of planting trees, shrubs, and perennial plants alongside food crops. The event will include a hands-on soil health assessment that you can try at home, plus ideas to help you manage your garden to best sequester carbon and adapt to a changing climate, as well as boosting biodiversity.
We will be taking a look at the trees recently planted at the farm to support its habitat management plan and hearing about the inspiration and challenges behind the farm’s wider Community Supported Agriculture project to create a regenerative market garden on the edge of town.
Have fun as you learn about the environmental benefits of planting trees, shrubs, and perennial plants alongside food crops at home.
We will be continuing to run a series of Farm Net Zero events in 2024, drawing on the needs and interests from the community of farmers. These will be advertised on our website and through this newsletter. If you have any suggestions for events we could run, please let us know.
As ever, if you have any questions or ideas that would further support the community of farmers that we are working with, please get in touch with the project team (contact details below).
All information about the project including upcoming events and resources are available on the Farm Net Zero website. If there is anything you would like to see featured please let us know.
We use cookies to ensure that we give you the best experience on our website. This includes analytics cookies to understand website traffic and how users interact with our website. We do not use any advertising cookies.
You may accept or refuse our use of cookies, or learn more at the link provided.
Strictly Necessary Cookies
Strictly Necessary Cookie should be enabled at all times so that we can save your preferences for cookie settings.
If you disable this cookie, we will not be able to save your preferences. This means that every time you visit this website you will need to enable or disable cookies again.


Recent Comments