

This month we’re focusing on how we account for emissions from fertilisers in our Farm Carbon Calculator.
Inorganic fertilisers can be entered in the Calculator using the “Inputs” tab and selecting either a “specific” (branded) or “average” product. The branded products included on the Calculator are those for which the manufacturers have been able to provide us with a robust carbon footprint or where they have communicated the formulation and country of production for the fertiliser ingredients so that we can estimate the carbon footprint for users.
The “average” options ask you to select the region of the world that the fertiliser was produced in, which you can see from the chart below has a big impact on the total carbon emissions associated with fertiliser use. European produced fertilisers tend to have lower embedded emissions because the factories producing them are fitted with emissions abatement systems.

The Calculator takes the quantity of fertiliser and uses emissions factors (from Brentrup et. al 2016) to work out the embedded carbon associated with that quantity of the fertiliser (i.e. the carbon emitted as a result of producing it) and then also estimates the CO2 equivalent of:
- the nitrous oxide (N2O) emissions in the soil associated with applying that quantity of fertiliser
- indirect ammonia (NH3) losses to the air due to volatilization
- emissions associated with urea hydrolysis (only for fertilisers containing urea)
Even small reductions in fertiliser use can have a big effect on a farm’s overall carbon footprint. The following chart shows a comparison of the same farm with three different scenarios. They are for illustration only as the impact on yield of reducing or changing the fertiliser usage can vary hugely from farm to farm. The baseline in scenario 1 (black) uses 30t of EU AN fertiliser and 30t of Mole Valley powerblend 26-14-14 to produce 1000t wheat on 100ha, 350t OSR on 100ha and 350t field beans on 100ha. They also spread 100% of the manure and slurry from their 40 head of beef cattle on the arable land.
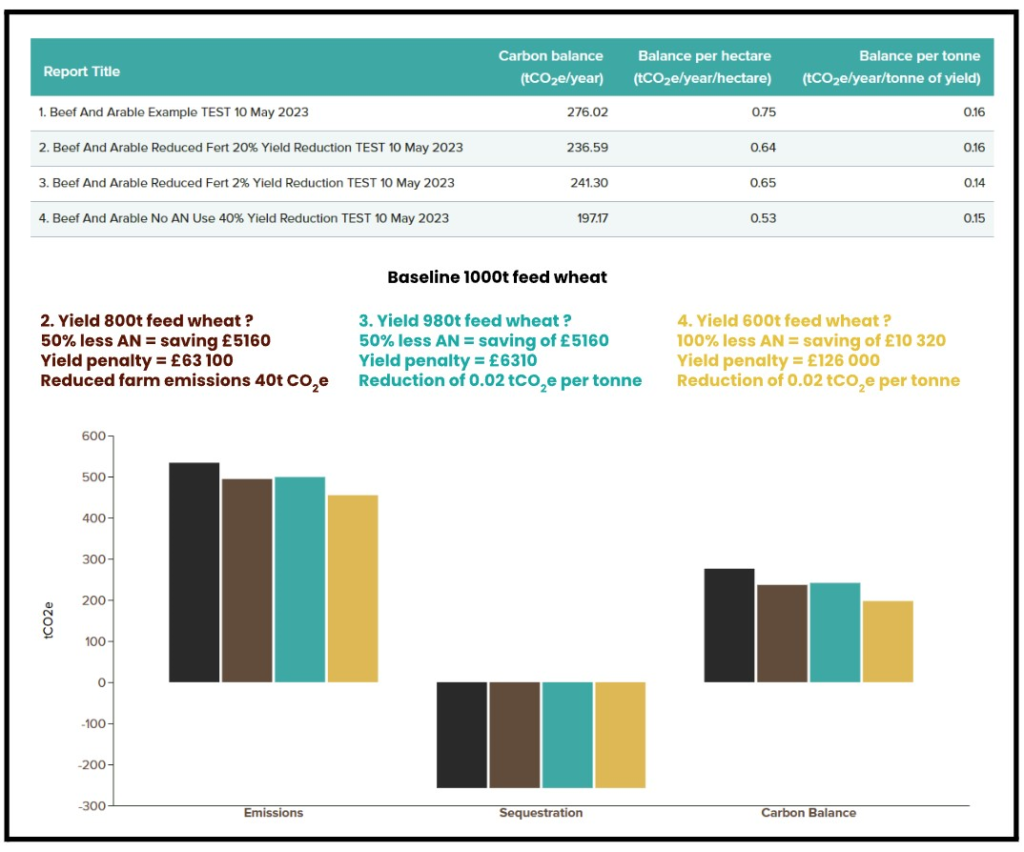
In scenario 2 (brown) the quantity of AN fertiliser has been reduced by half to 15t but all other N sources have been kept the same. This reduces the carbon balance by approximately 40t CO2e. For some farms this might have a large impact on yield while for others the impact may be minimal depending on the soil quality, crop/ variety being grown, timing of applications and which crops are prioritised in terms of N demand.
Even if this reduction in AN use resulted in a 20% reduction in wheat yield, the per tonne footprint of the crops remains the same between the baseline fertiliser use and scenario 2. It is also worth considering the financial saving of reducing AN fertiliser by 15t (at the time of writing this would be a saving of approximately £5160 at £344 per tonne).
Assuming the reduced fertiliser application is on the highest value crop (wheat in this example), and taking the price of Yorkshire feed wheat (£315.5 per tonne) to estimate the financial hit of an extreme 20% reduction in wheat yield between scenario 1 and 2, this would equate to a cost of £63 100. In contrast, in scenario 3, we have shown the same inputs but with only a 2% yield reduction for wheat compared to the baseline, for which the yield penalty would equate to £6310, assuming the fertiliser saving can be made by reducing application on the less valuable crops/ pasture. At the current price, the saving on fertiliser does not outweigh the cost of the yield reduction but with both markets fluctuating so much, there will be times when it is advantageous.
In scenario 4, we’ve gone so far as to remove any AN fertiliser (though of course in this example farm there is still 30t Mole Valley 26-14-14 and the beef herds’ manure and slurry being applied). This reduces the total emissions of the farm by 79t CO2e. We have modelled a 40% reduction in wheat yield here which would obviously equate to a huge cost of £126 200 (using the same assumptions as above) if the wheat were being sold. However this yield reduction may still be acceptable where the wheat is being fed to the beef herd and the farm exceeds it’s requirements. Alternatively, in this case, the farm might consider switching to a different rotation to be able to feed the cattle the required ration without the need for the high cost of AN fertiliser (scenario 4 represents a saving on fertiliser of £10 320 compared to the baseline scenario 1).
This is an example report, and of course, the real-world decisions on how to reduce fertiliser use are much more complex. AHDB have some research and guidance on what may or may not be feasible here and a tool for calculating fertiliser adjustments here. Alternatively you can get in contact with our team of advisors who have lots of experience weighing up the pros and cons of fertiliser reduction in each unique setting.
Getting in touch
If you have any questions/comments please email [email protected]
Find out more
You can find all our useful calculator resources here.