
At Farm Carbon Toolkit, we know that planning for the future is vital to any business. That’s why we’ve been working hard to create a more formalised system of scenario planning in our Farm Carbon Calculator. And today we’re excited to unveil the new beta version of this functionality, which will give growers and those in the supply chain key insight into the management of their business.
While it was previously possible to scenario plan in the Calculator, we’ve built brand new functionality that makes the entire process clearer and simpler to steer you towards achievable actions.
Scenario Planning In The Calculator
When planning for the future, it helps to be able to visualise the changes you want to make. Scenario planning can help you to plot a roadmap for your business, and see the impact that operational changes could have on your carbon emissions.
Here is a rundown of all the new scenario planning functionality in the Calculator, and how you can use it for key insights into your business.
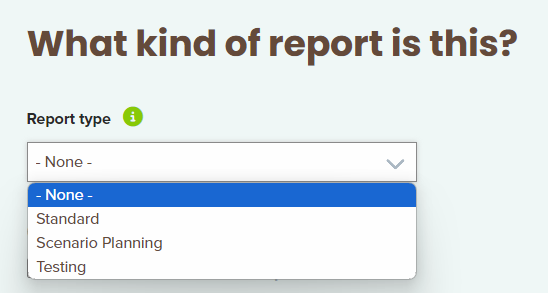
Report Types
In order to make scenario planning easier and clearer, there is now a ‘report type’ option in the Calculator – which will make it clear if the report you’re looking at is a standard report, a test, or a scenario plan. It also helps us filter out scenario plans from our benchmarking datasets.
Creating Scenarios
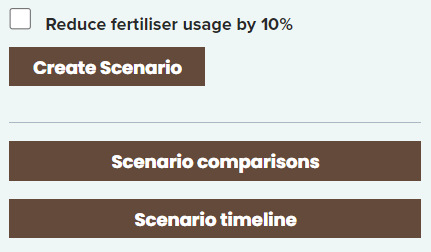
There is now a ‘Scenarios’ button on the report results screen, which will bring up several options when you click it (see the screenshot below). When you’ve finished a report, use the ‘Scenarios’ button to start building your plan for reducing your footprint or explore how you could improve the sequestration potential of your farm.
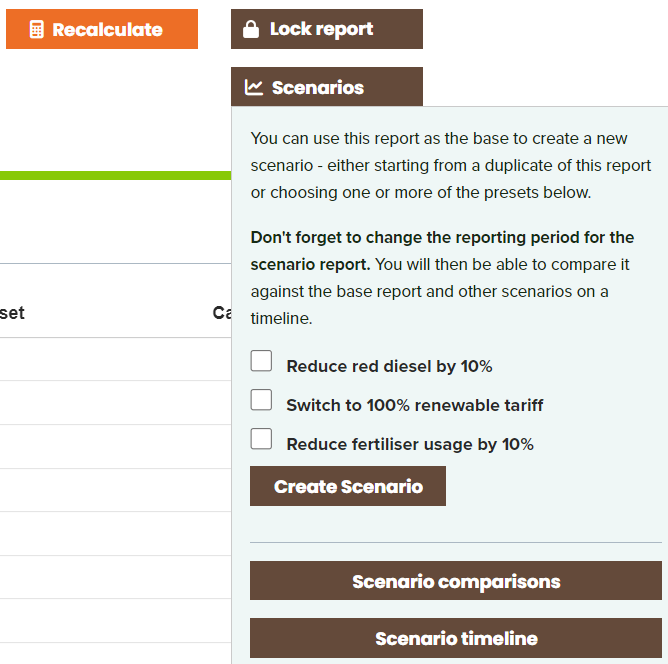
Presets
Firstly, you’ll be able to choose preset scenarios that let you see the effect of changing business parameters. The presets are:
- Reducing red diesel usage by 10%
- Switching to a 100% renewable energy tariff
- Reducing fertiliser usage by 10%
Selecting any or all of these options, and then clicking ‘Create Scenario’, will create a scenario based on the criteria you’ve chosen. You can also leave the presets blank, and just click ‘Create Scenario’, in order to build your own customised scenario plan building on the data you entered in your original report.
N.B. In time, we intend to make more preset options available – but the scenarios above represent fairly typical changes that many growers look to make, and so offer a useful starting point.
Editing Your Scenario Plan
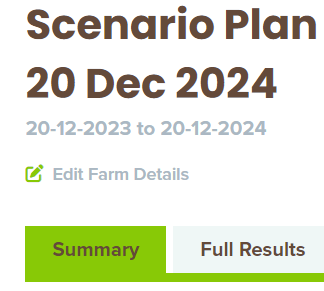
Once you have created a scenario, you’ll need to click ‘Edit farm details’ on the report page so that you can edit the date your scenario plan applies to.
Setting the date is important for our timeline and comparison views, which you can use when you’re ready to see the effect of your scenario planning.
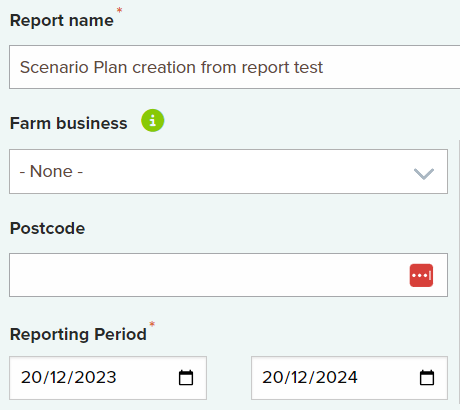
If you’re building a scenario yourself, or want to change some details on a preset, then simply click ‘Edit data’ in the report results screen. Here you can make any changes you want in the same way as in a standard report.
Comparing And Visualising Scenarios
There are two ways to access a report comparison – the first is through the ‘Scenarios’ button in the report results page – from here, you have ‘Scenario comparisons’ and ‘Scenario timeline’ options. These buttons will take you to the relevant comparison type – more on that below – for any scenarios associated with the report you’re working on.
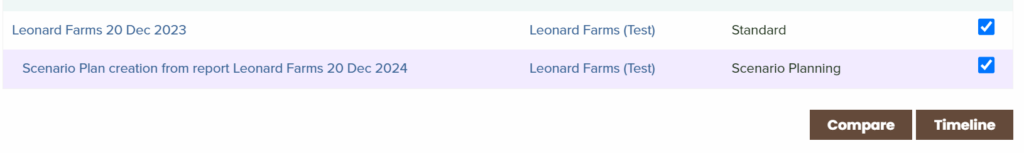
Alternatively, you can also access comparisons by clicking ‘Dashboard’ and then selecting the ‘Comparisons’ sidebar button. From here, you’ll need to select the reports you want to compare – note that linked reports and scenarios appear next to each other automatically. Finally, select either the ‘Timeline’ or ‘Compare’ option – we’ll dive into what each of these options mean next.
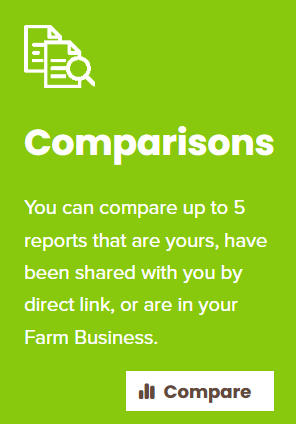
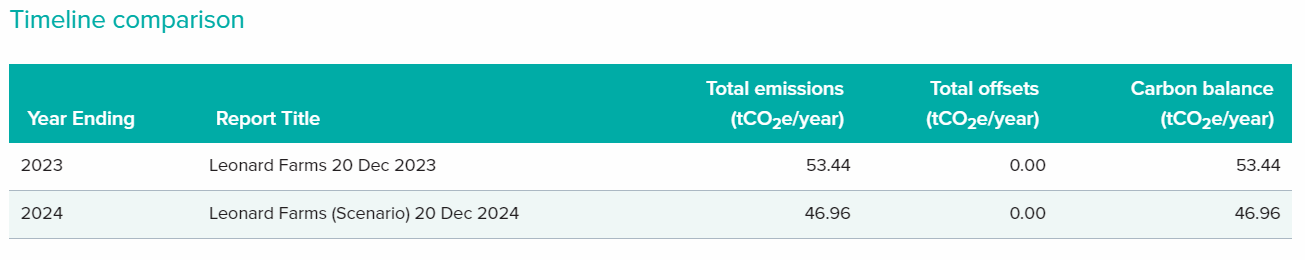
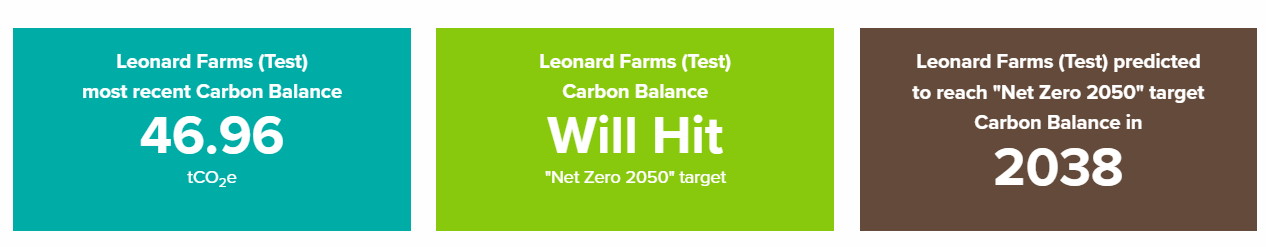
Comparison Types – ‘Timeline’ And ‘Compare’
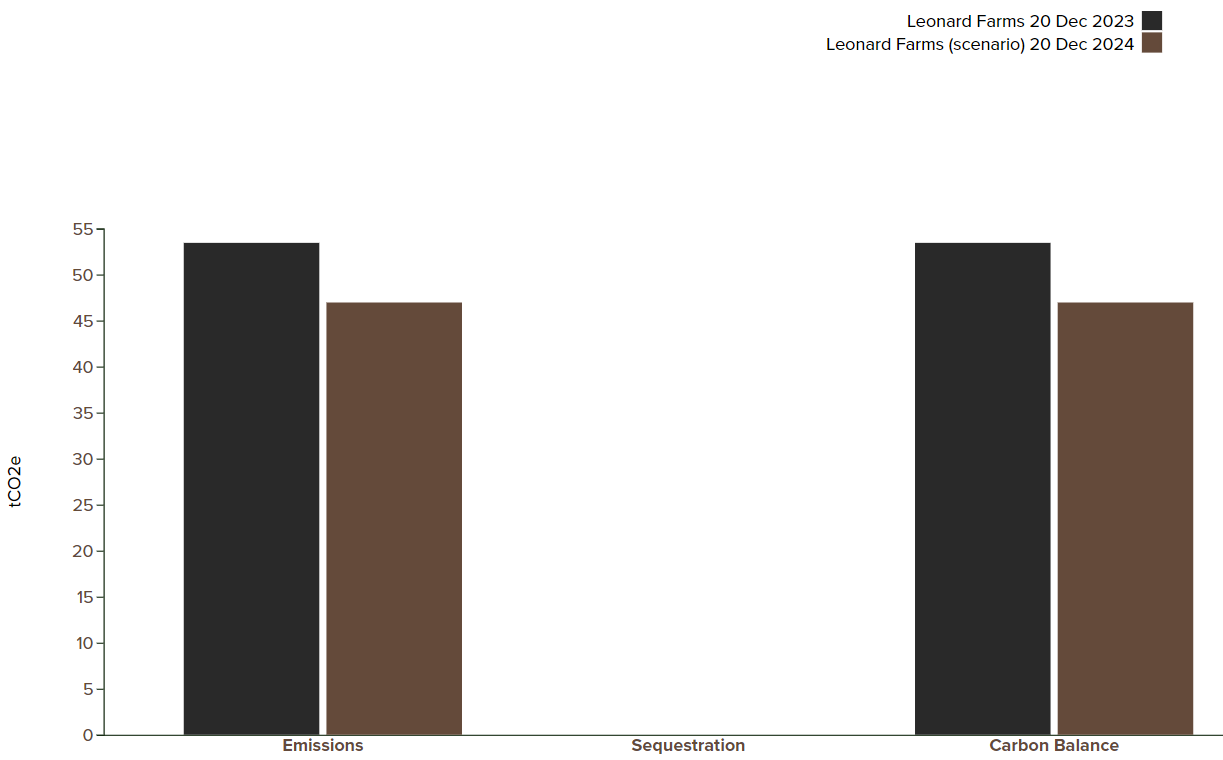
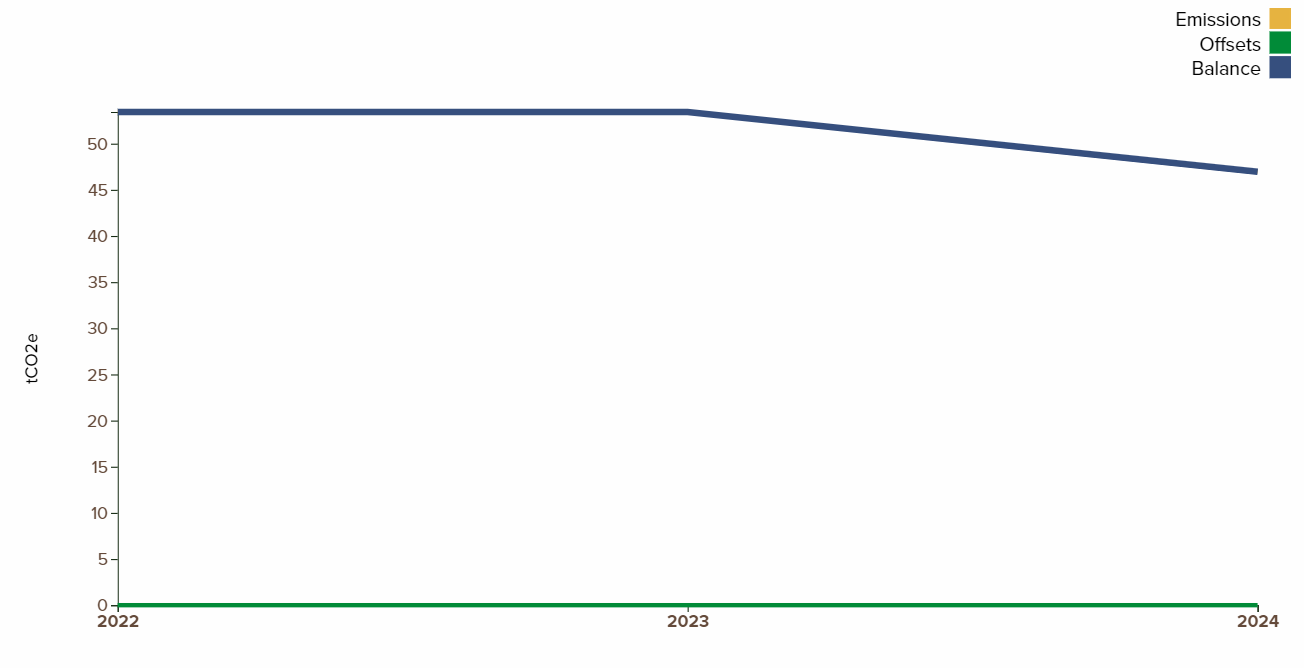
Our Timeline and Compare views offer two different ways of visualising your data. In the simplest terms, ‘Compare’ shows you key metrics and KPIs in a tabular format, while ‘Timeline’ shows your progress over time and towards a net zero target date (2050 by default).
If you want a detailed, granular view of your business, emissions and sequestration, then it’s best to use the Compare view. If you are looking for an overview and direction of travel, you’ll probably prefer the Timeline view.
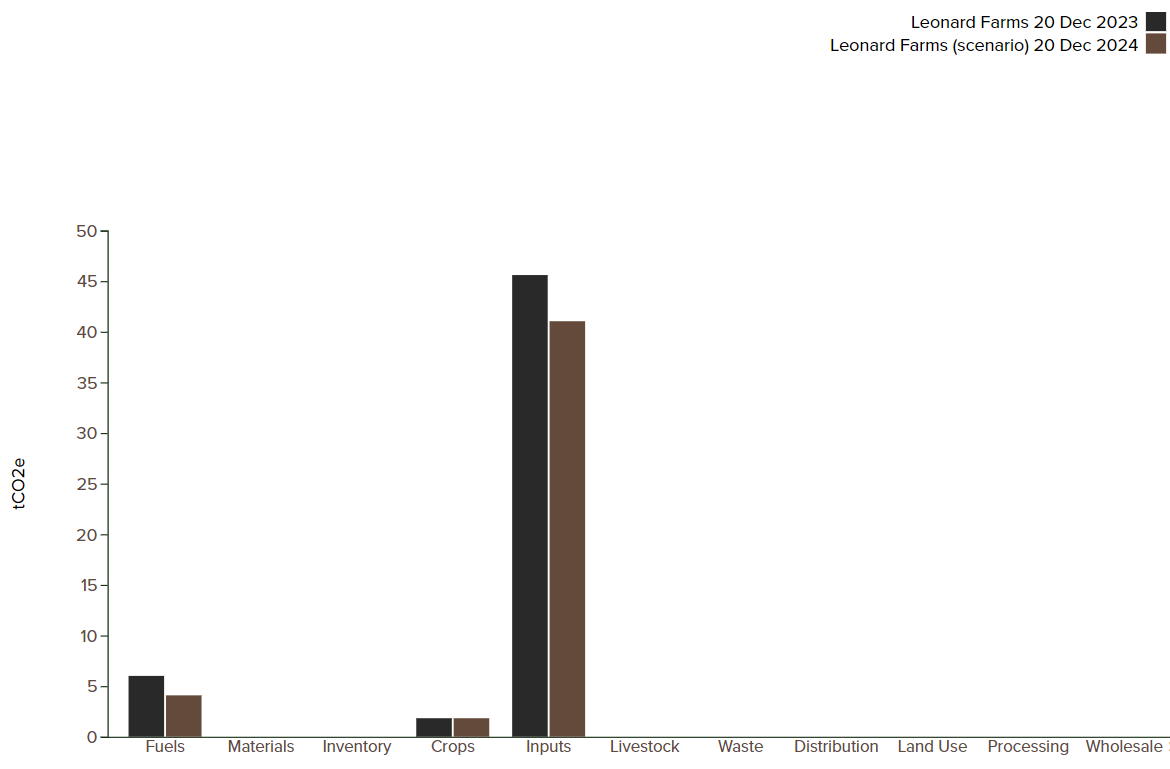
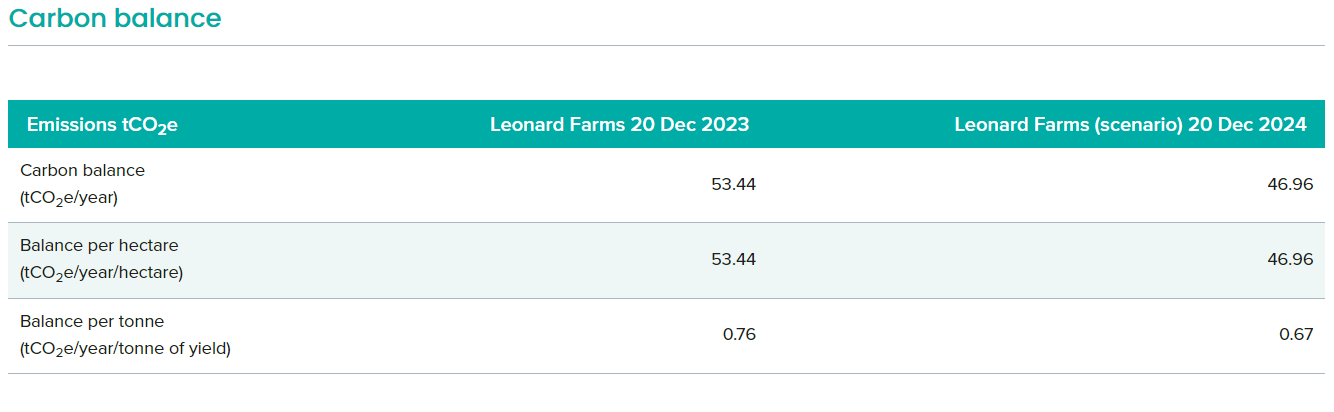
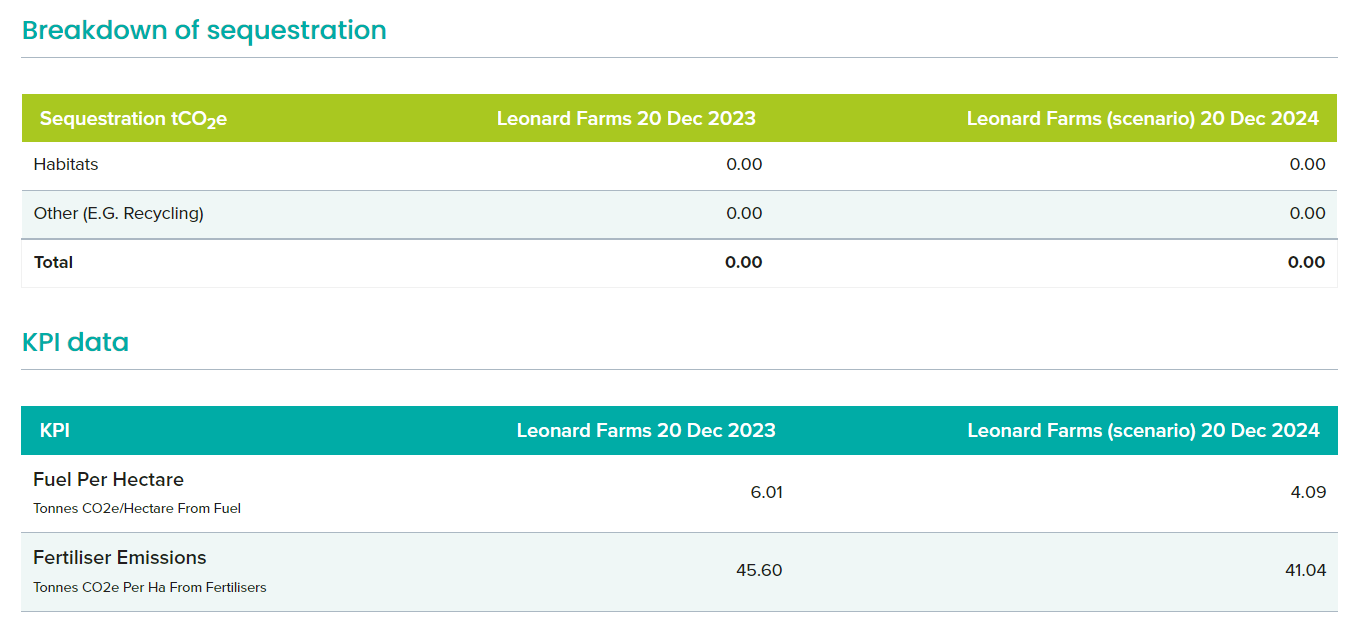
Click through the image gallery below to see some examples of the ‘Compare’ view data.
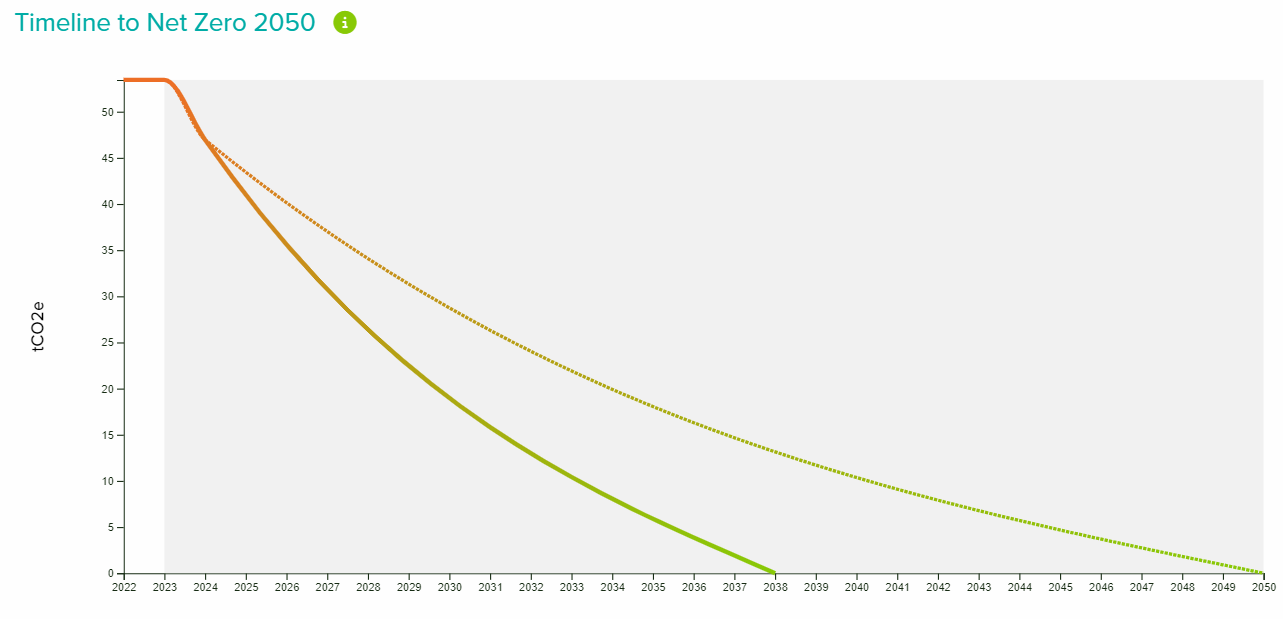
And below are some examples of what the ‘Timeline’ view will show you.
Future Development
We’re excited to see how scenario planning will help businesses to reduce emissions and achieve their targets. Looking forward, in 2024 we’ll continue developing the Calculator, and as always our focus will be on helping farmers and businesses both track and reduce their carbon footprint.
You can always get in touch with us to find out more or let us know what you need from the Farm Carbon Calculator [email protected].