Farm Net Zero is a major project from the farming community in Cornwall to show the contribution that agriculture can make to achieving net zero. Here’s content from the latest newsletter, sent the farmers, growers and the wider community this project supports.
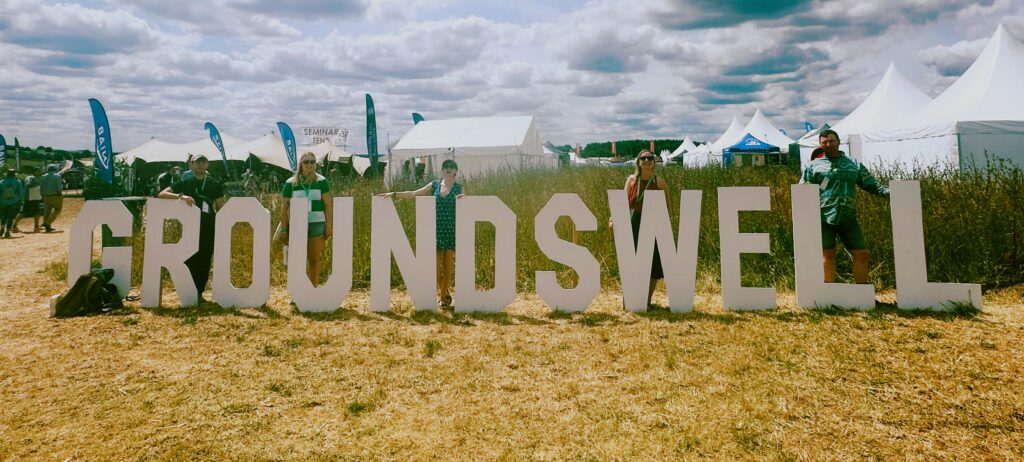
Groundswell
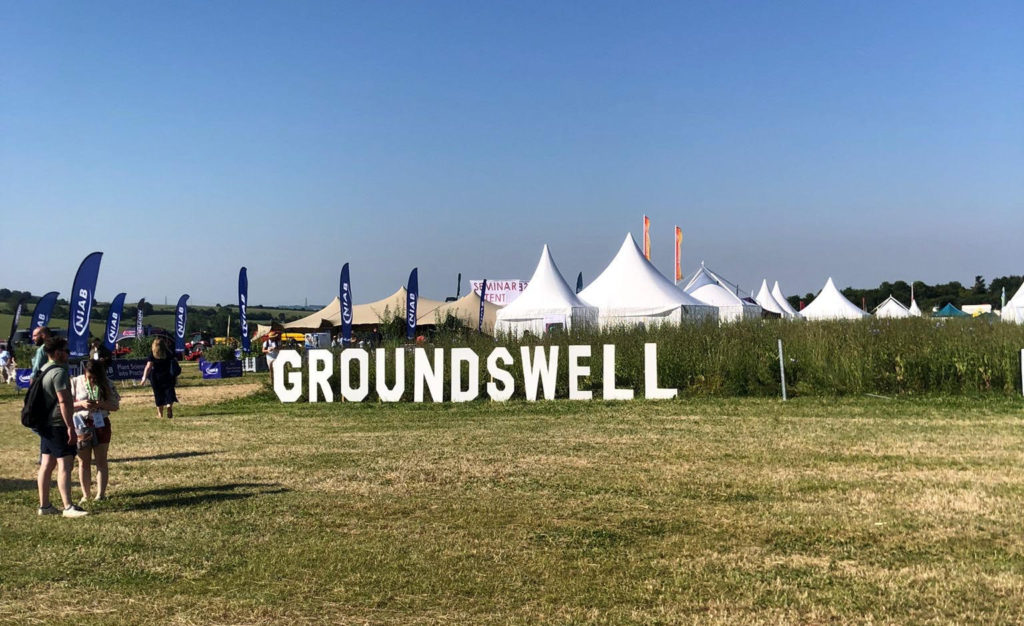
It was lovely to see some of the FNZ farmers and project staff enjoying Groundswell this year. Well done to those who spoke at various sessions throughout the conference. We were also pleased to provide tickets for a group of new agriculture graduates from Duchy College to attend.
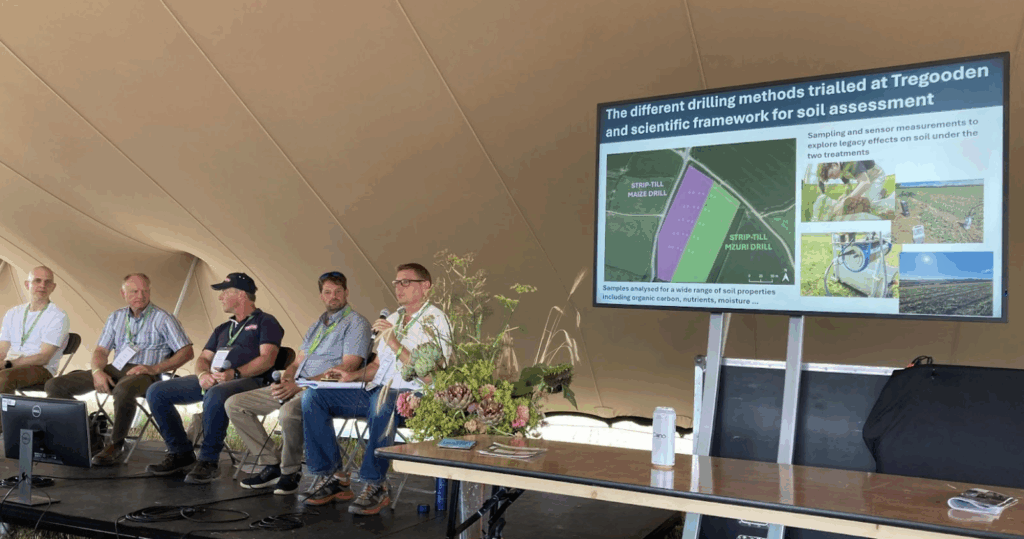
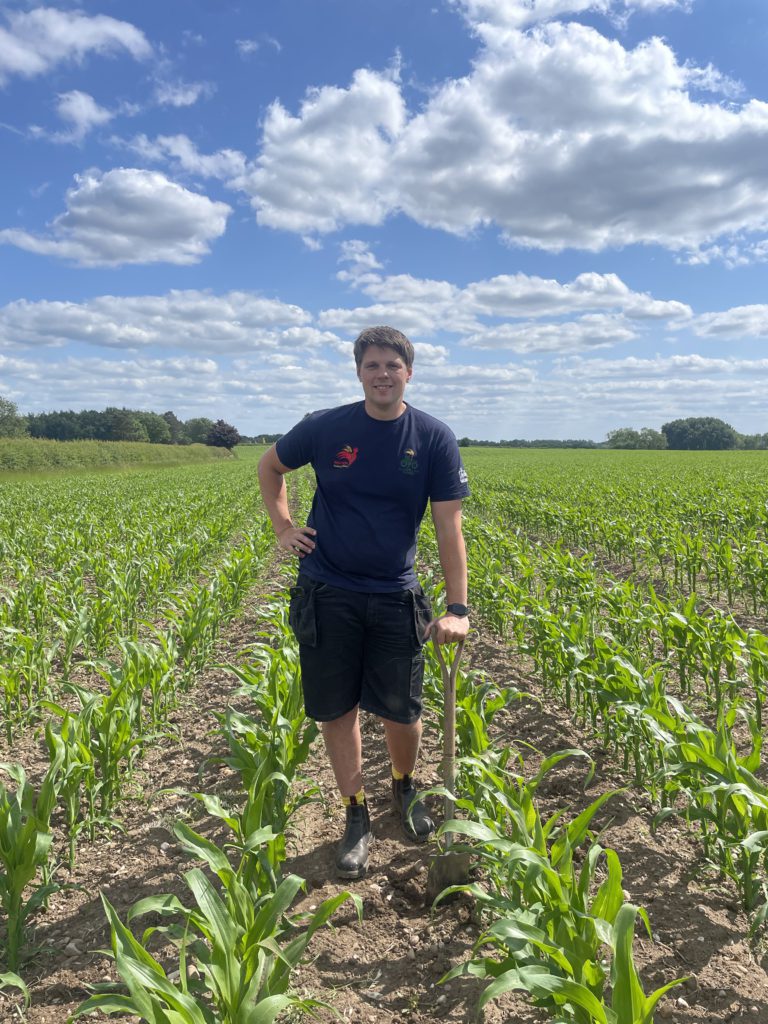
Maize Field Lab featured at Groundswell
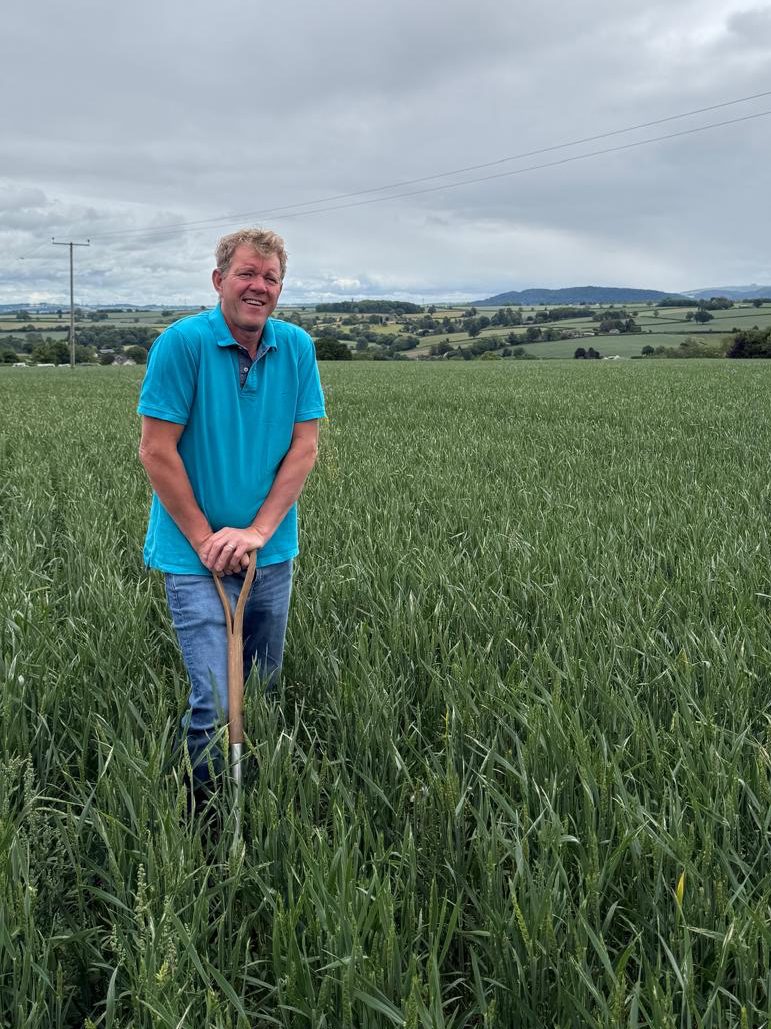
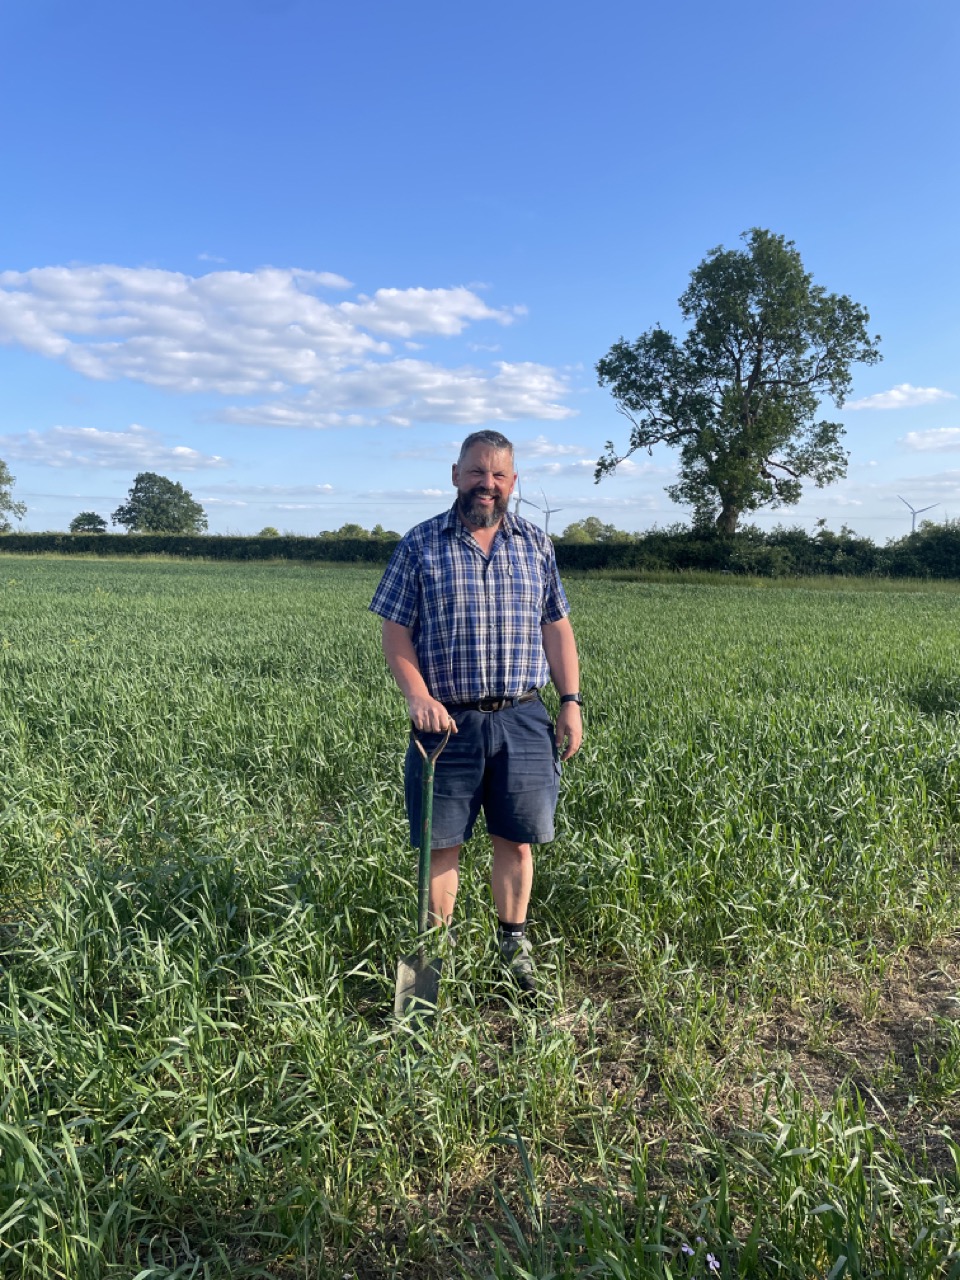
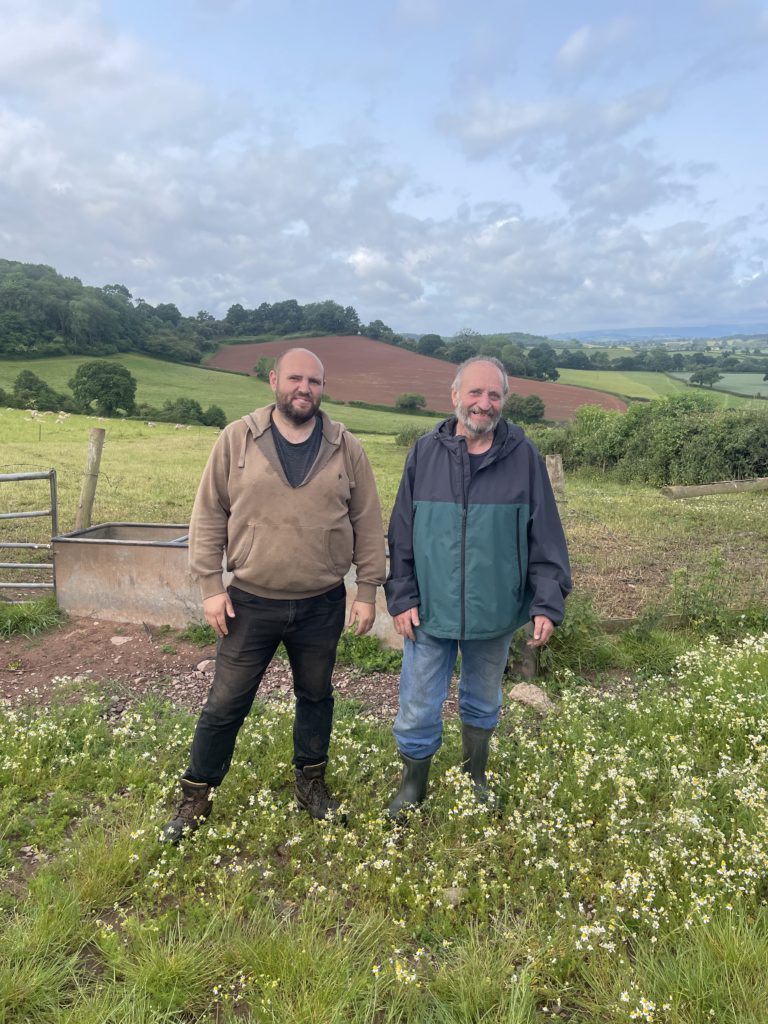
The FNZ Maize Field Lab was featured at Groundswell in the “Beneath the Surface” session to an audience of roughly 80 people. FNZ farmer Malcolm Barrett talked about his farm trials, looking at different maize establishment practices (comparing light discing with direct drilling against strip tilling).
He explained that his overall aim to move away from ploughing is to produce a good crop with fewer inputs, and explained how they’d already reduced their fertiliser use by 65% as a result. His motivation for taking part in the field lab: “We wanted reassurance that what we’re doing is working for the farm and for the soil”.
Professor Will Blake of the University of Plymouth (the field lab researchers) explained how useful the trial has been for informing their research into soil: “It’s been fantastic for us to collaborate as it’s enhanced our understanding of how these sensors work”. The final report for the trial will be available soon on the Innovative Farmers and FNZ website.
Monitor Farm Update
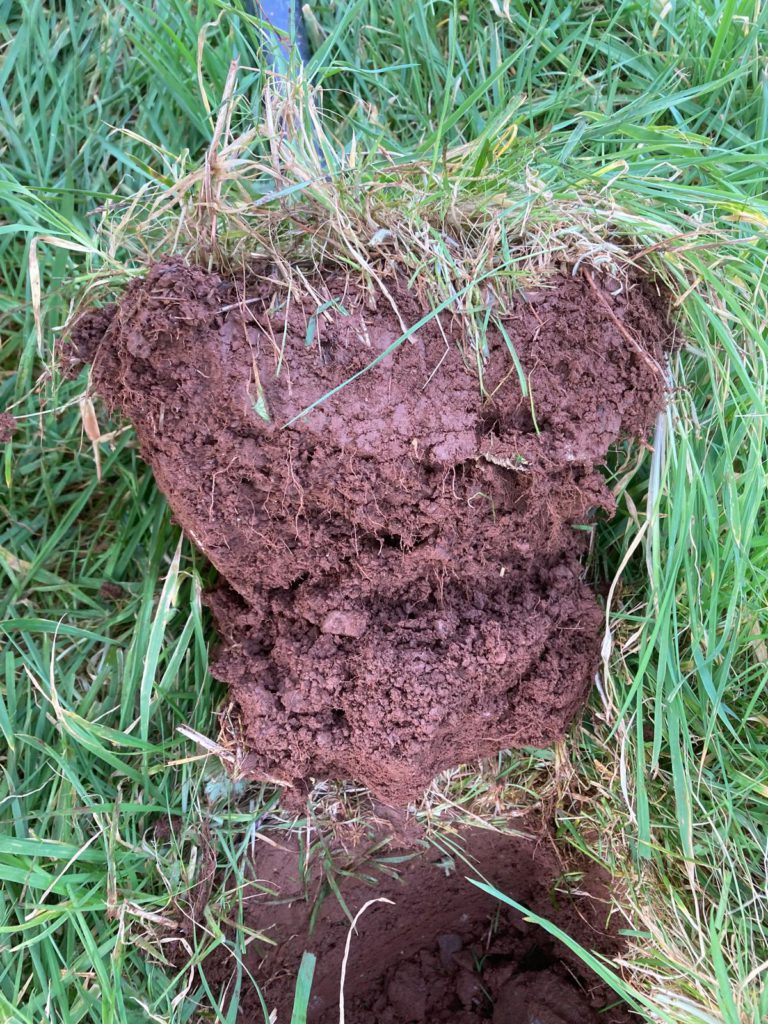
We are getting stuck into the final set of FNZ soil sampling and carbon footprinting. It is very exciting to see the changes on farms since the start of the project back in 2021, both above and below ground. It has also been heartening to hear how many of the project farmers are keen to carry on with the project in some form.
Please make sure you have arranged a visit with your FNZ contact and can provide the carbon footprint data during August.
Events
It has been an action-packed time for events over the last couple of months, with some excellent, well-attended events on a range of topics:
Royal Cornwall Show
5-7th June 2025
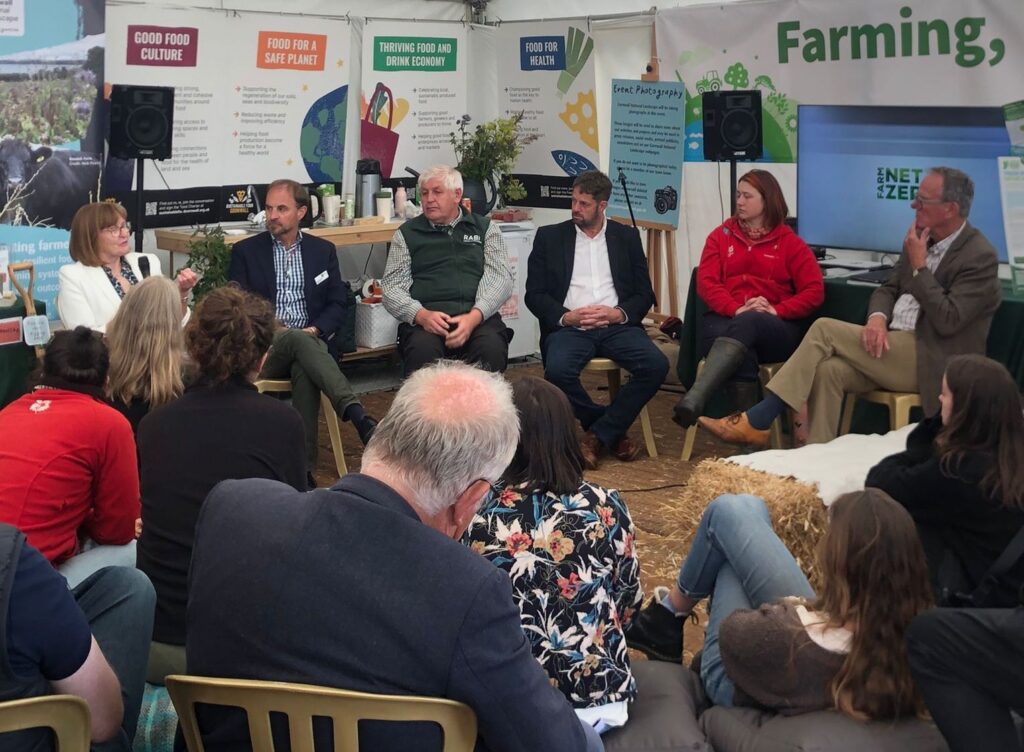
We were pleased to be at the Royal Cornwall Show again this year, sharing a stand with the Agri Carbon Kernow project at the Cornwall Council’s Farming, Food & Nature Hub.
It was a great opportunity for us to meet with farmers, other organisations and the public, to share our knowledge and experiences gathered through the course of the project. A big thank you to everyone who supported on the stand. It was great to see so many monitor farmers drop in to the Hub and well done to those who spoke on the panel sessions.
Treway Herbal Ley Revisit
12th June 2025
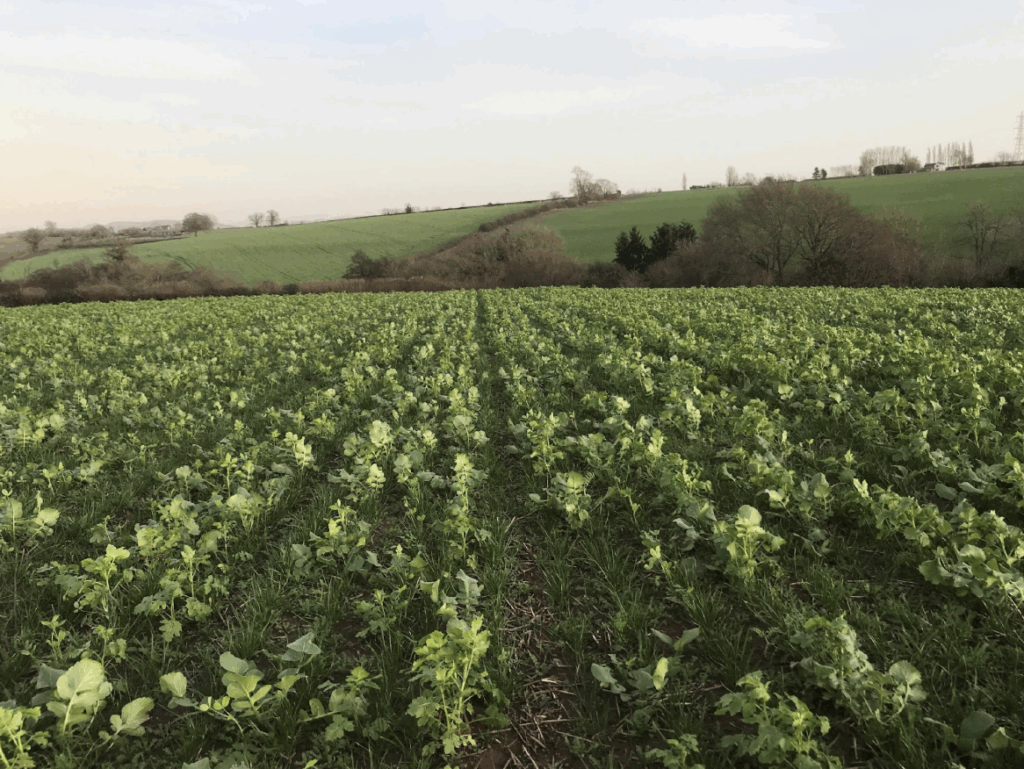
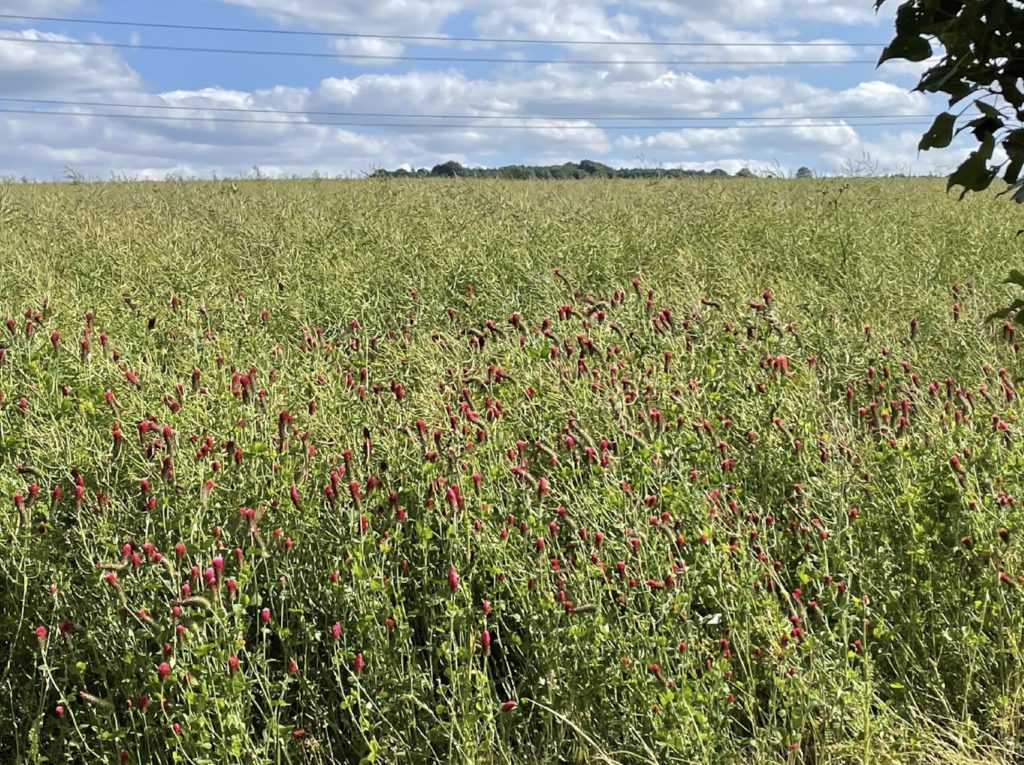
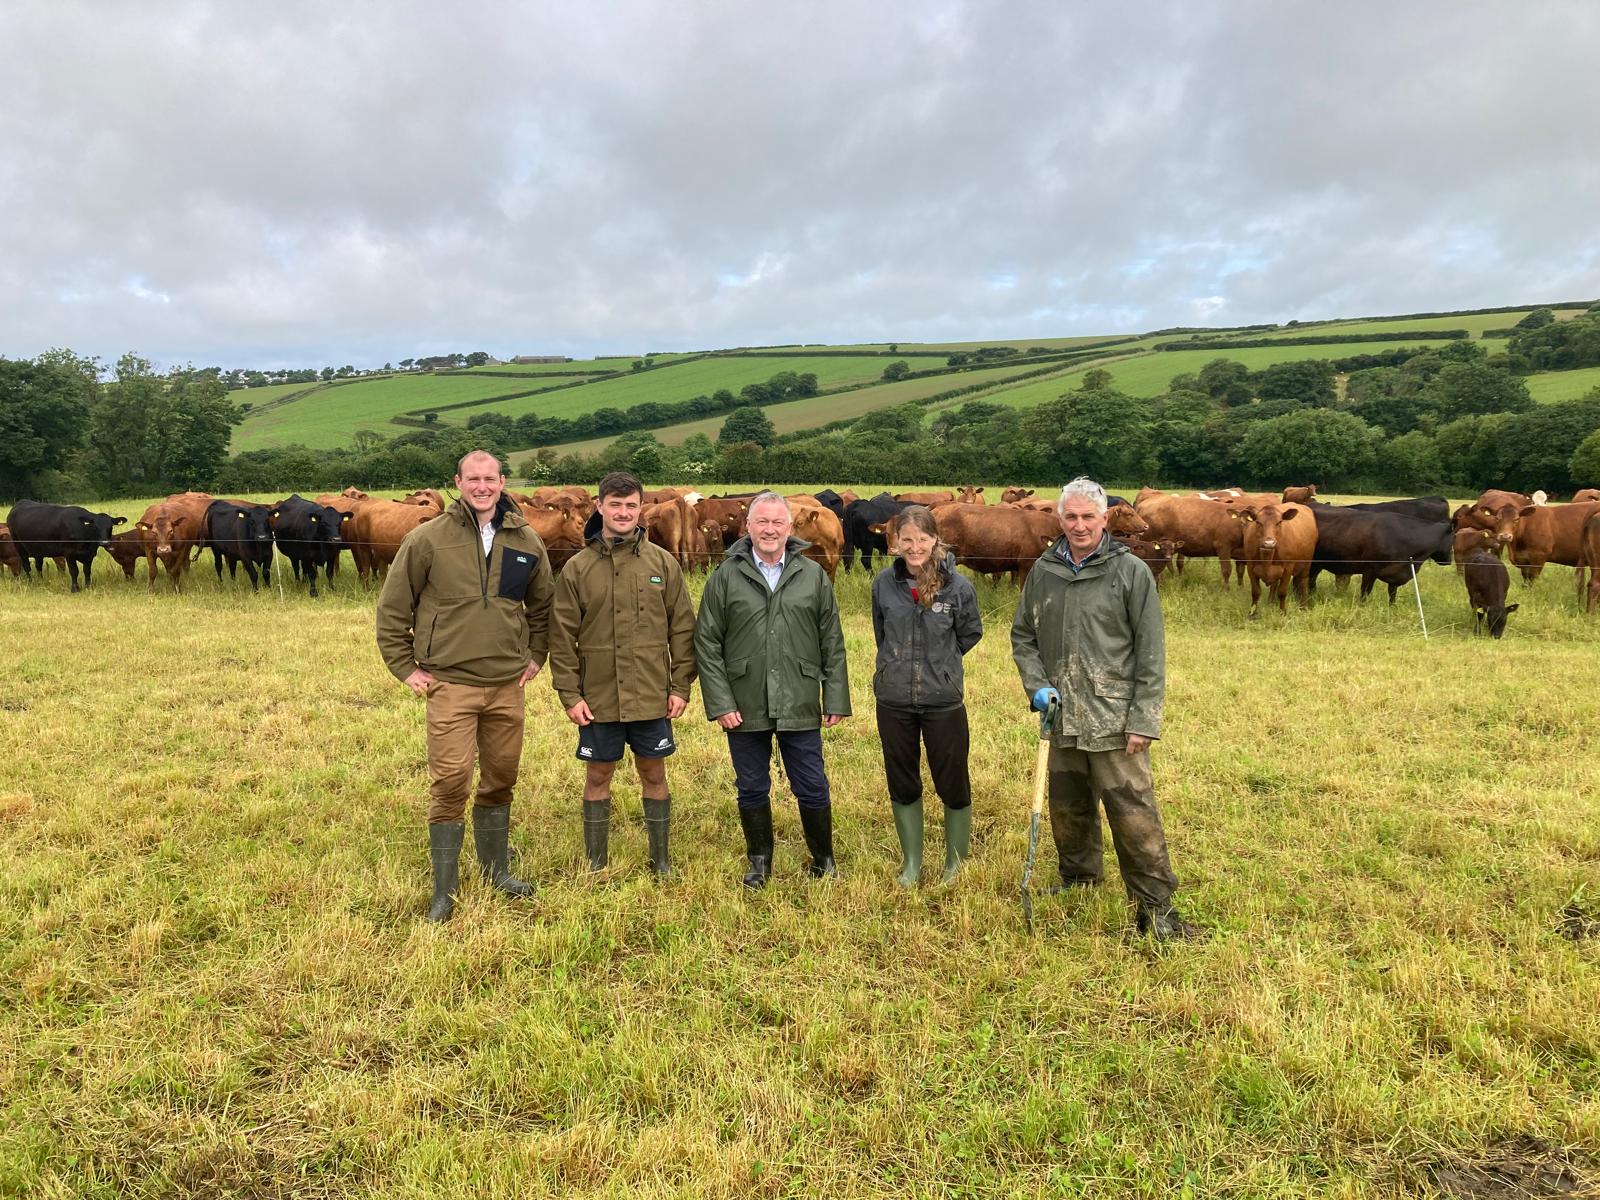
We returned to Treway Farm, courtesy of FNZ monitor farmers Will and Kate Martin, to visit the Farming in Protected Landscapes “Herbal Ley Enhancement Network” trial plots as they become more established. It was interesting to see that the best establishment was in plots where either there was greater soil disturbance or the existing sward was sprayed out.
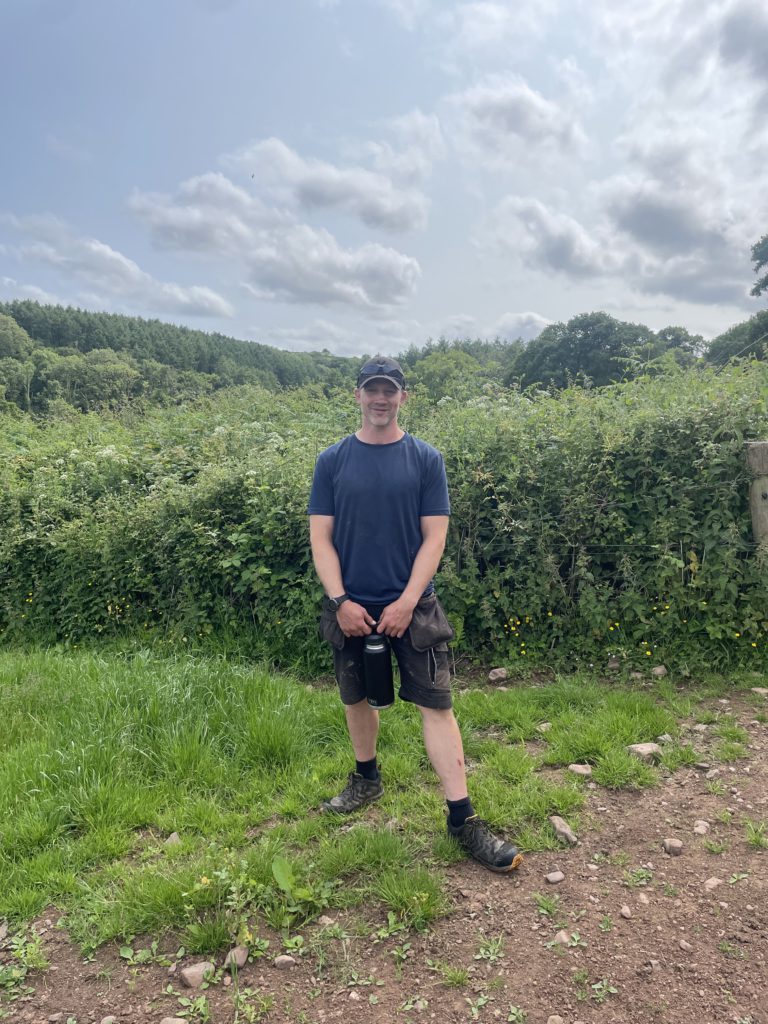
Trees for Forage
9th July 2025
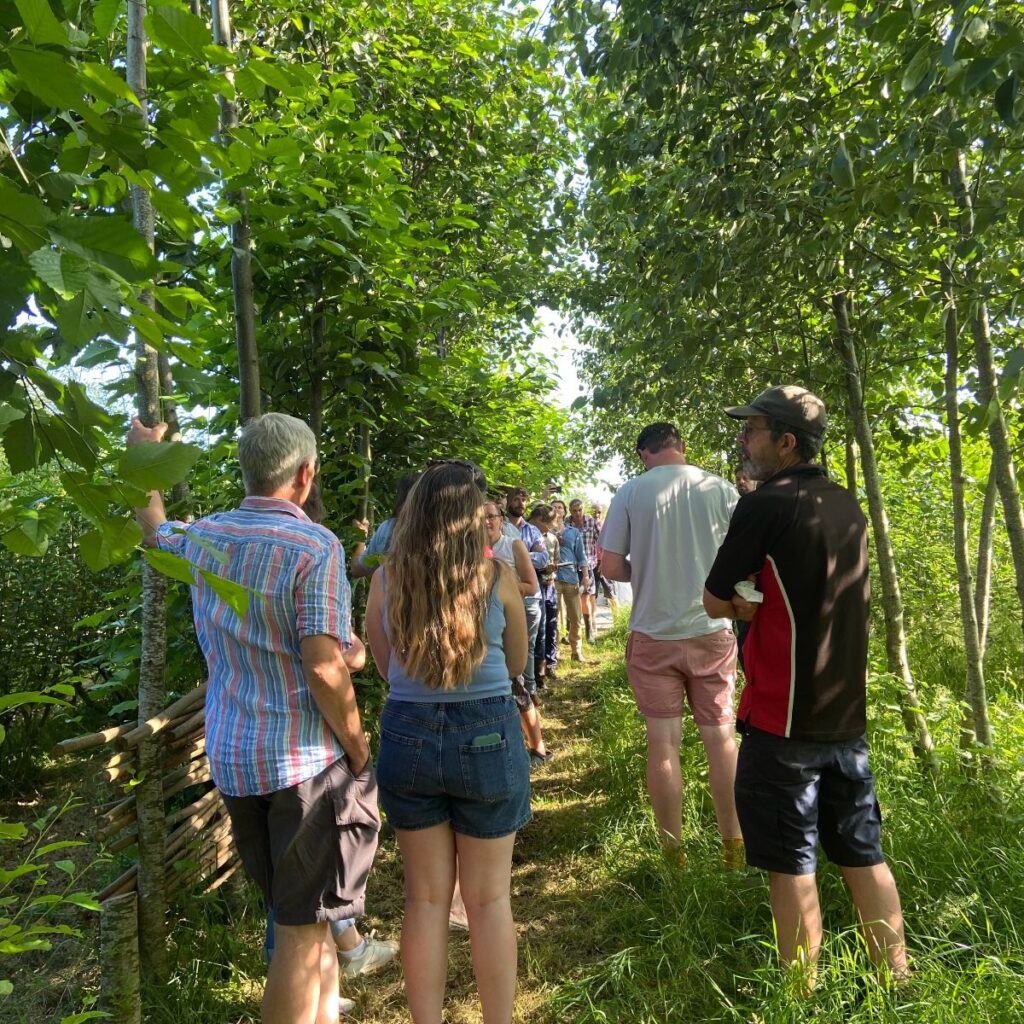
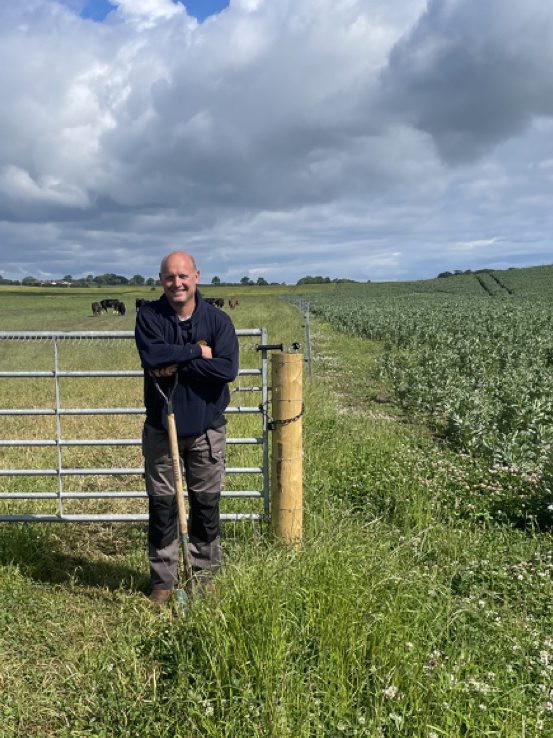
A fascinating meeting at Arbor Farm, St Columb on the benefits of trees on farms. The hot weather made it abundantly clear that trees will provide valuable shade and shelter for livestock, maintaining their health and welfare. Steve Evans of Arbor Farm led a practical discussion on how to integrate trees on the farm, with lots of useful tips on successful establishment, including the importance of hedge laying.
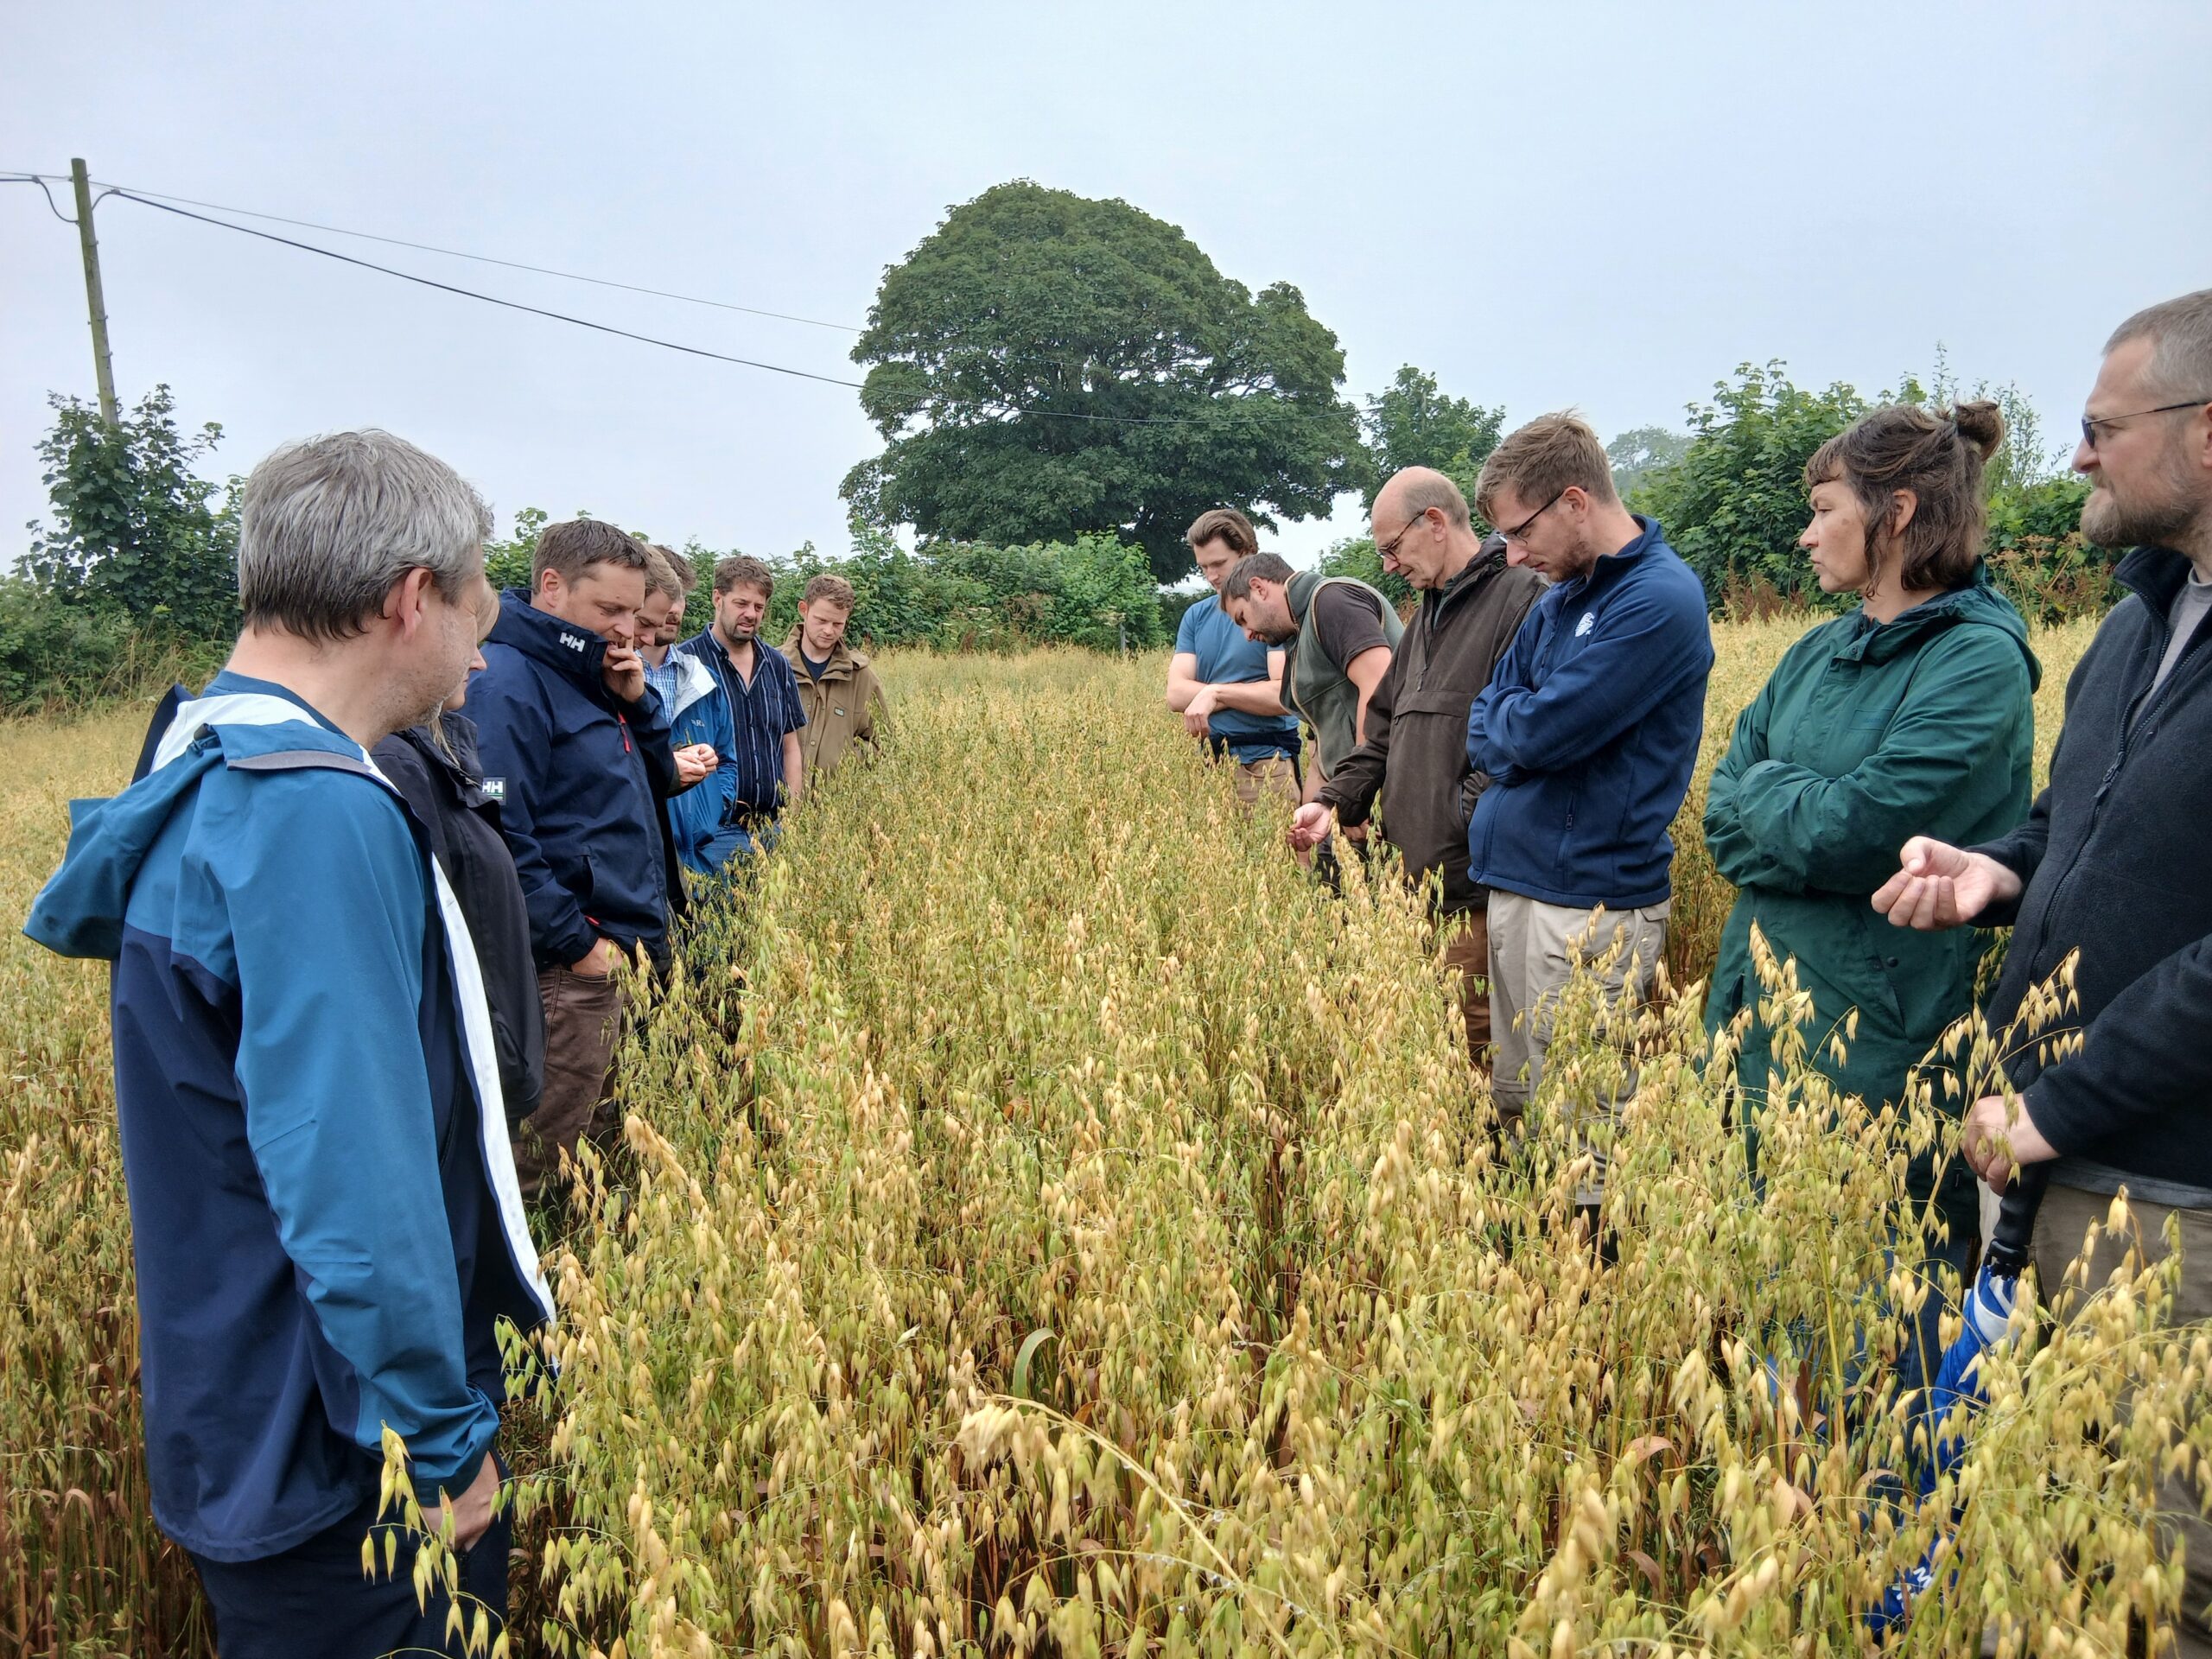
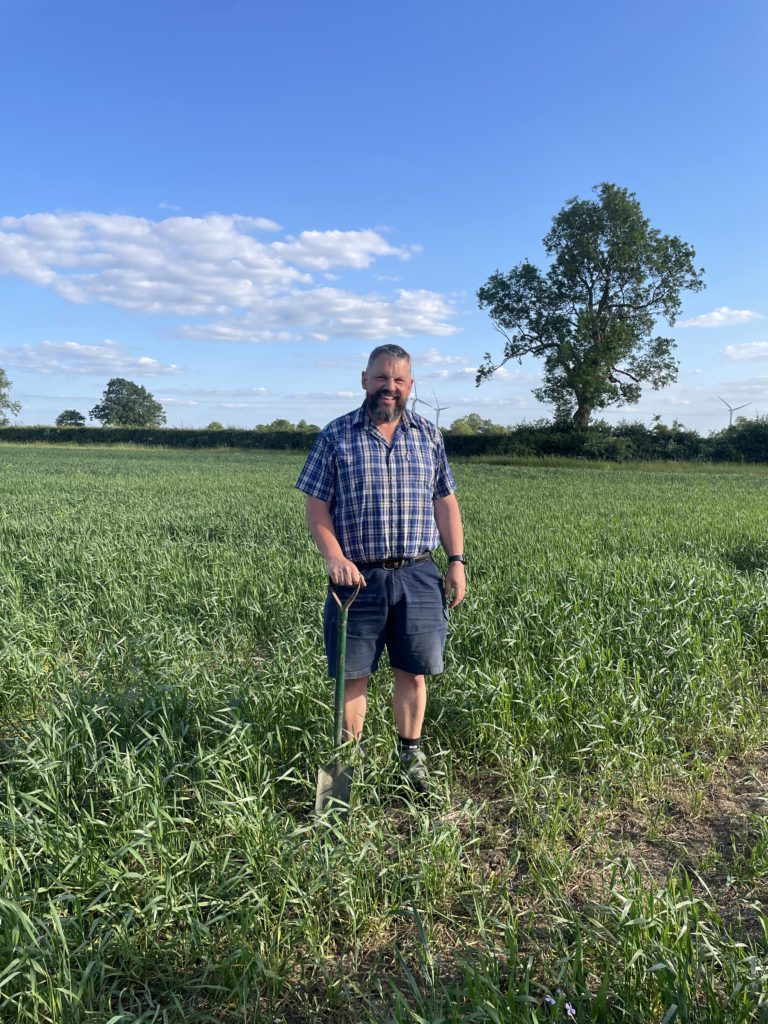
Pensipple Wheat Septoria Trial
16th July 2025
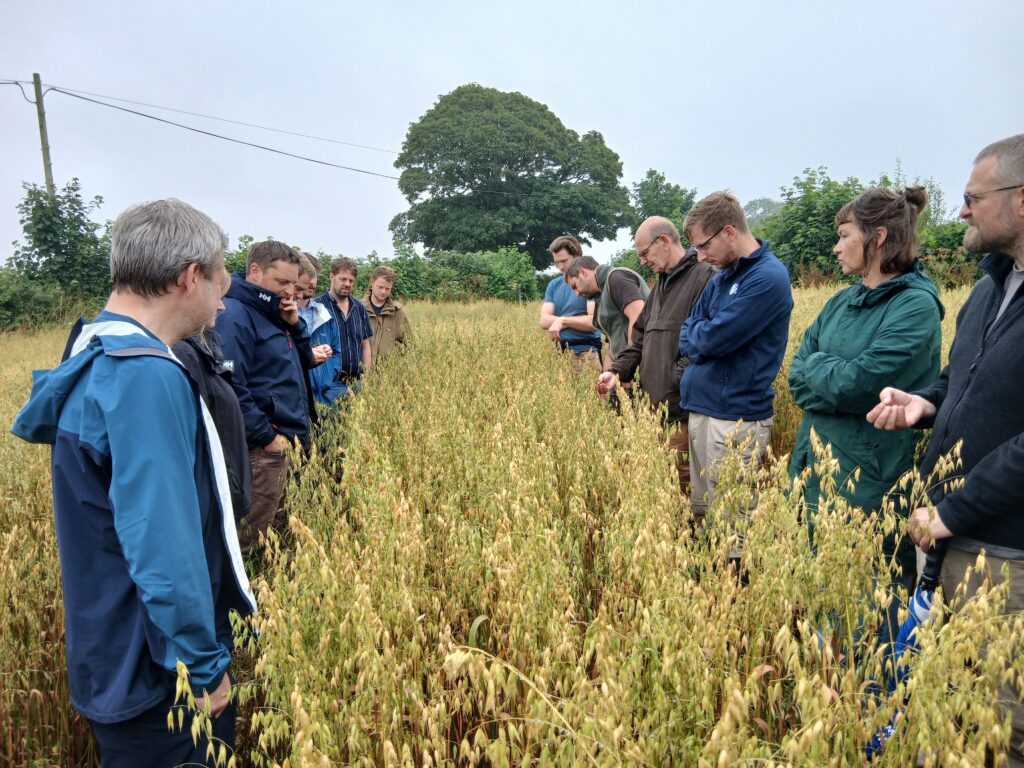
An opportunity to visit FNZ Demo Farmer, Anthony Ellis, at Pensipple Farm, and learn about his ongoing experiments with biological inputs on cereals. We had excellent discussions with microbiologists from the University of Exeter, who provided insight into the function of biological products which Anthony has been using instead of conventional sprays. The purpose of this trial is to reduce inputs and costs whilst maintaining a healthy plant, supported by healthy soil.
We also heard how Anthony is integrating sheep into the system by grazing the wheat crop in late winter to successfully remove diseased leaves and how willow is being used as a sheep feed supplement.
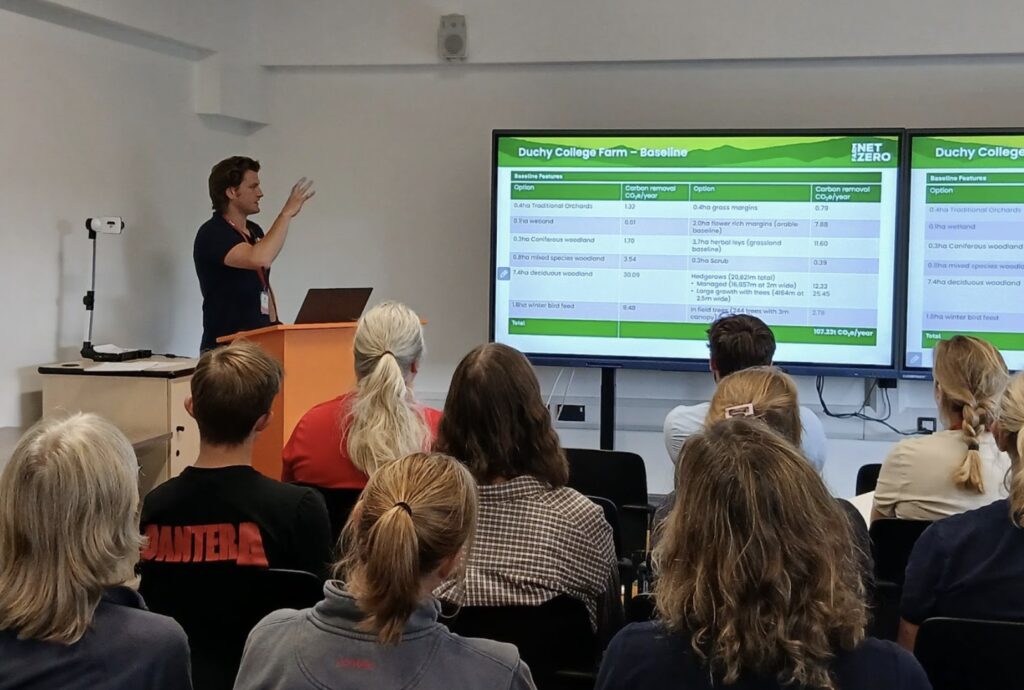
The Role of Habitats in Farm Carbon Footprinting at Duchy College, Stoke Climsland
18th July 2025
As part of our programme of events for professionals that support farmers, we held a well-attended day for ecologists on the positive contribution that farm habitats can play in improving a farm’s carbon balance.
Alex Bebbington provided an overview of carbon footprinting. Anthony Ellis gave a farmers’ perspective, with data from his farm. While Stefan Marks from FCT used the college farm to demonstrate the sequestration potential of natural capital. RBS director Robin Jackson demonstrated some of the important considerations when planning and implementing the natural capital developments at the college. After lunch, Gemma Eales (Duchy College) and Zoë Smith (WRT) gave an excellent guided tour of the college’s tree planting programme and network of leaky dams.
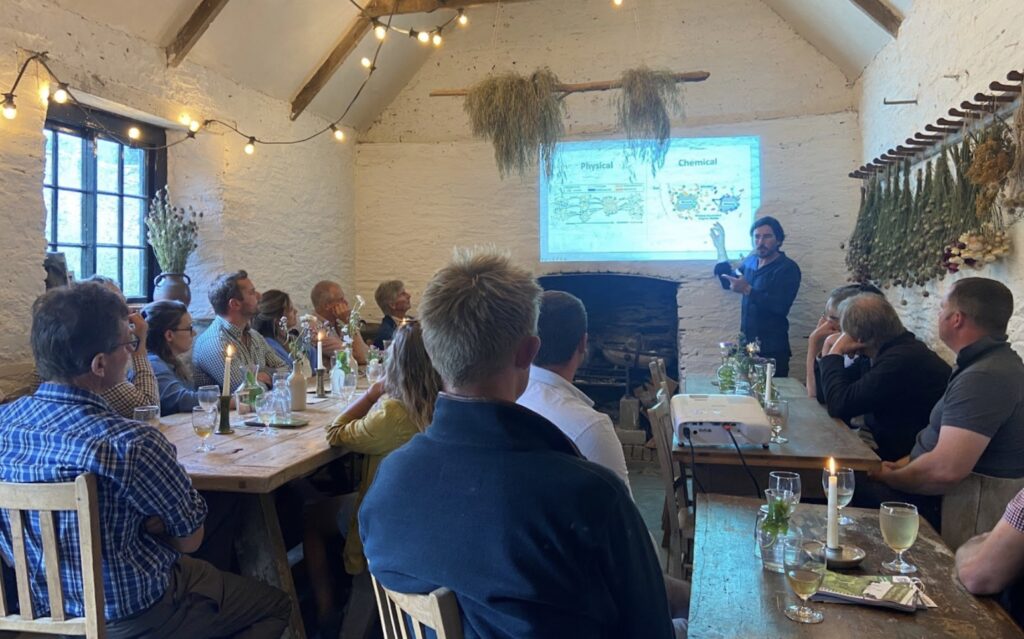
Joel Williams at Prideaux Walled Garden
22nd July 2025
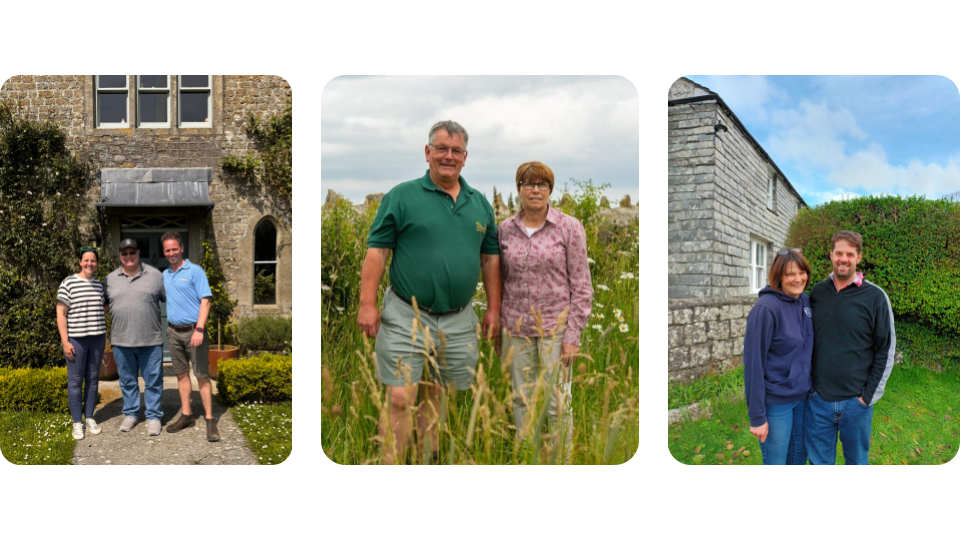
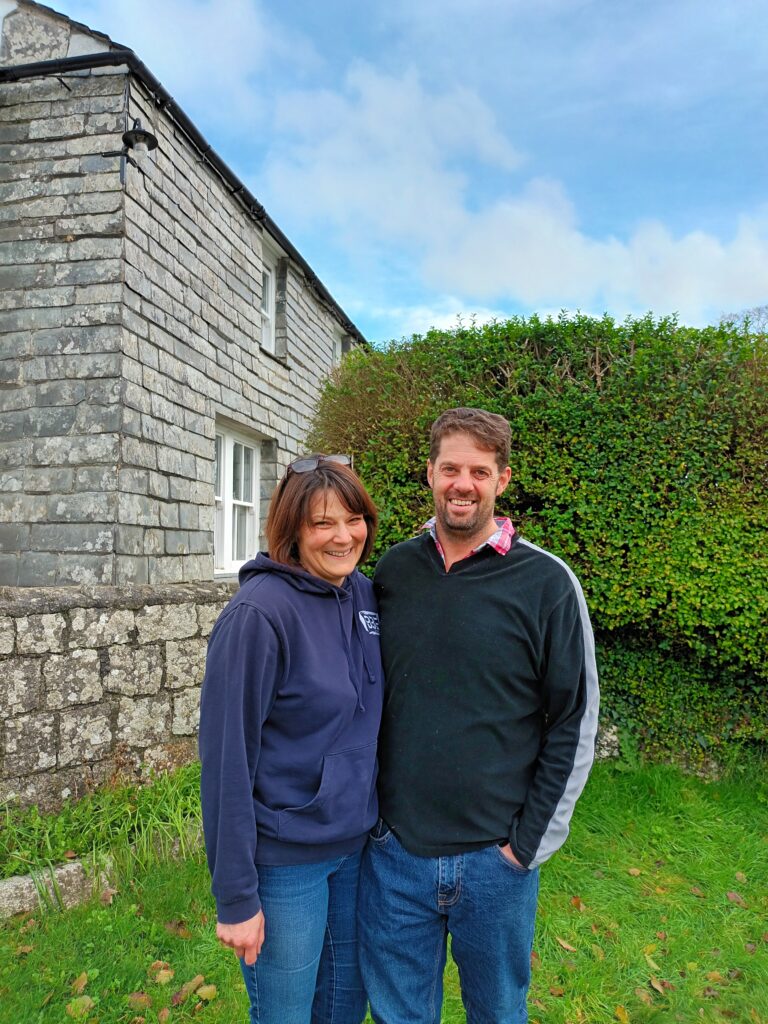
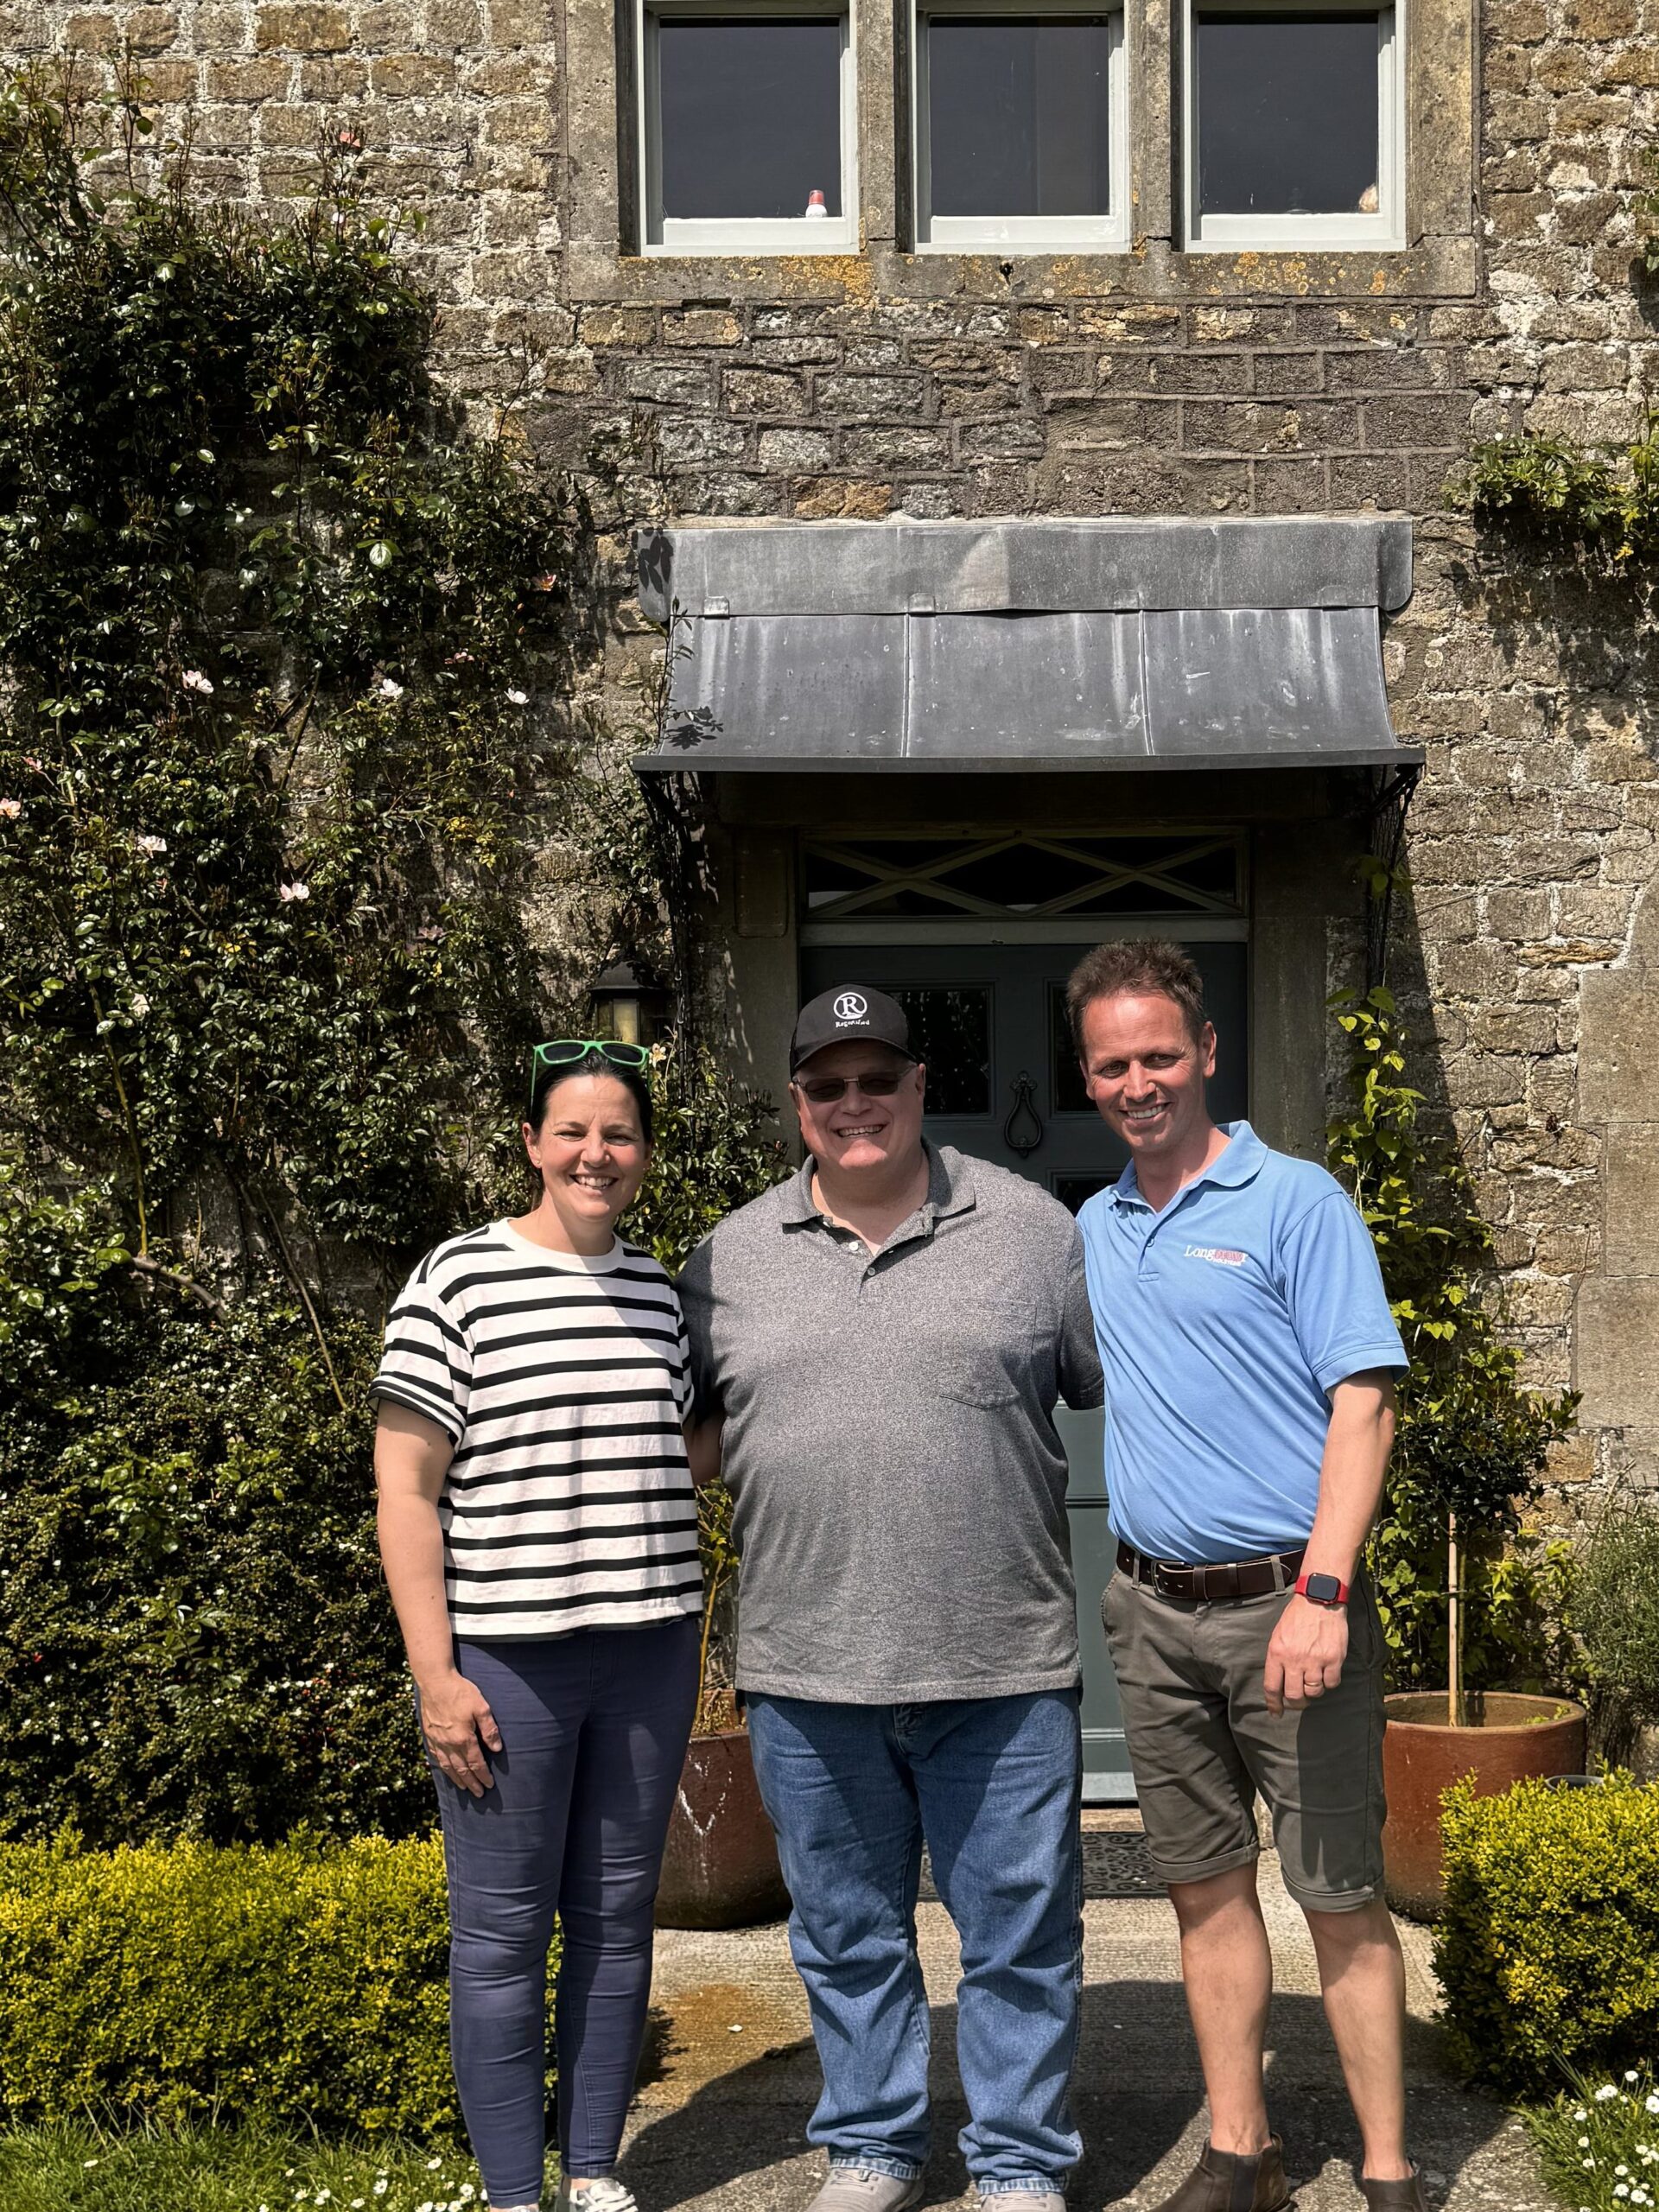
We were extremely fortunate to host internationally renowned plant and soil health educator Joel Williams for an evening meeting and dinner at Prideaux Walled Gardens, courtesy of FNZ monitor farmers Martha Prideaux-Brune and Emma Restorick.
Joel gave a fascinating presentation about different soil organic matter fractions, their role in carbon storage and the mechanisms by which carbon is sequestered into the soil. Many thanks to FNZ demo farmer Mike Roberts for inviting and hosting Joel and for making the event happen. We will be producing a factsheet full of information garnered from Joel during the evening.
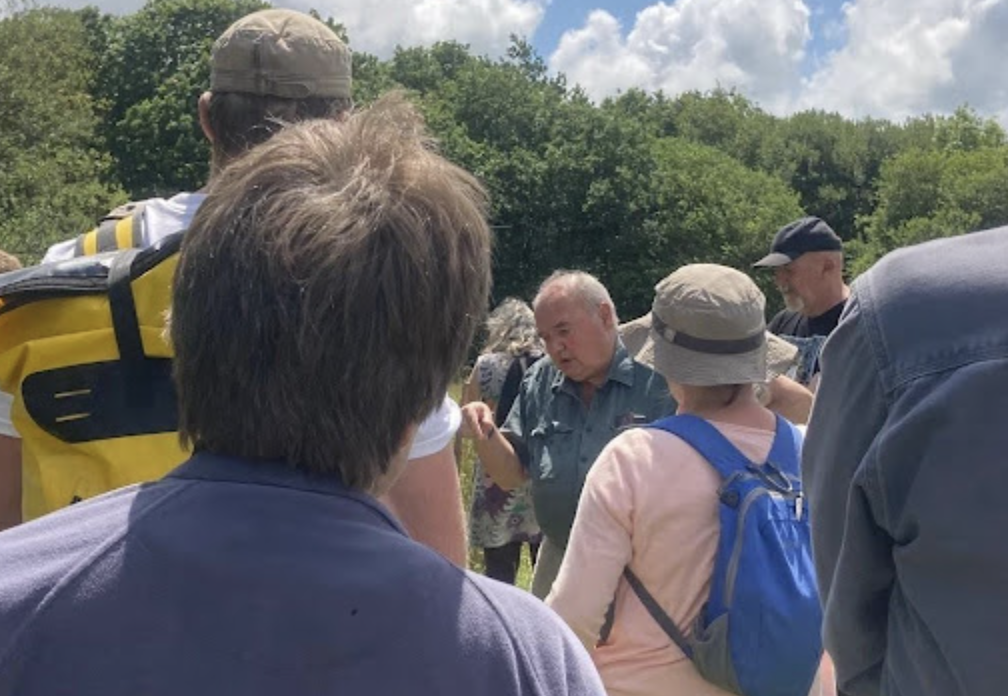
Citizen Workshop: An Introduction to Ecology and Nature Recovery in the Westcountry
2nd July 2025
As part of the community outreach programme, the Westcountry Rivers Trust hosted a workshop at Woodland Valley Farm near Truro, attended by 23 people keen to learn about ecological processes, nature recovery and farming’s role in restoring biodiversity.
Budding Nature explained the importance of food webs and how gardeners and consumers can help ‘re-nature’ green spaces. Chris Jones then led a tour showing how agro-forestry and mob grazing have boosted grassland diversity, with abundant butterflies, dragonflies and other wildlife thriving alongside the beef herd.
The visit concluded with a walk through the beaver enclosure, where wetlands created by the animals support rich biodiversity and enhance the farm’s water resilience. A successful and inspiring event.
Farm Net Zero In The News
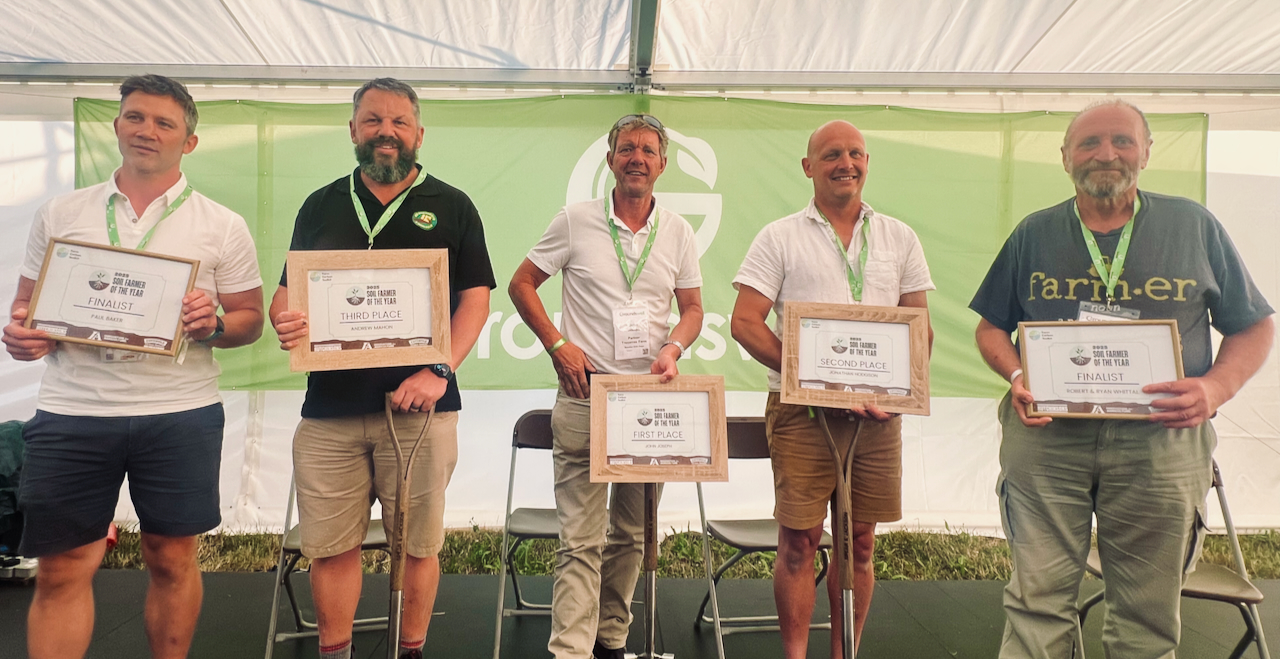
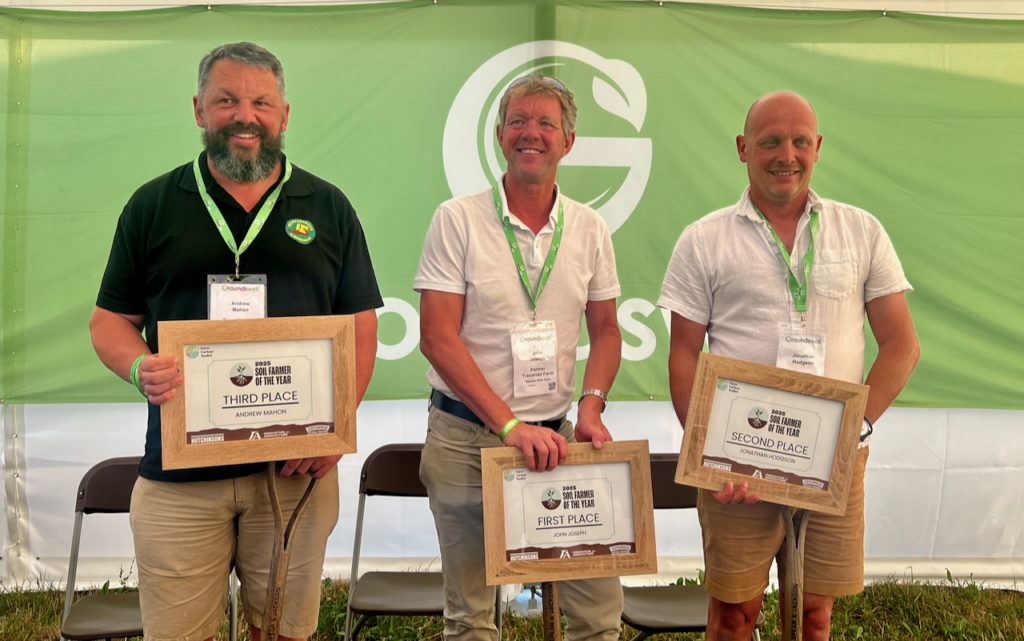
We’ve been making headlines this summer. In June, monitor farmer Roger Halliday featured on the Farmers Weekly front page in an article on hedgerow management and carbon capture. That same month, demo farmer and Carbon Farmer of the Year finalist Anthony Ellis was profiled in the Farmers Guardian’s “Regenerative Special”.
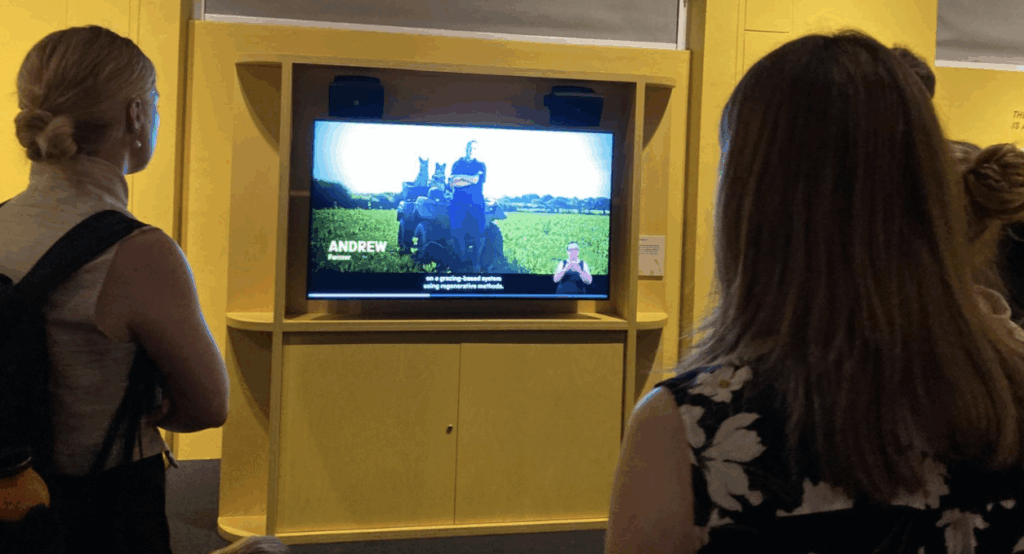
Our work has also reached wider audiences: Innovative Farmers has shared films of FNZ research driven by farmers’ questions, while Andrew Brewer of Ennis Barton is contributing to the Future of Food exhibit at the National Science Museum, with his role fully recognised in shaping the vision for food.
And coming soon, Emma Restorick and Martha Prideaux-Brune will appear on Gardeners’ World to share their work on regenerating a walled garden, composting and soil health. We don’t yet know when it will air, so keep an eye out!
Resources
New resources are always being added to our resources page, with some of the most recent here below:
- Video: Plant Pathology Webinar with Mike Harrington
- Factsheet: Wheat: alternative options for the control of Septoria
- Event write-ups: The Journey at Pensipple and Trees for Forage
Field Labs: to read more about the wide range of topics covered by farmer Field Labs, visit the Innovative Farmers Knowledge Hub.
What Next?
We have several events coming up, including:
- 12th September – Calf Rearing at Trendeal Vean near Truro
- 9th October – Scadghill Farm, North Cornwall, incl Tow and Fert
- TBC October – Change Makers Event at Deer Park Farm
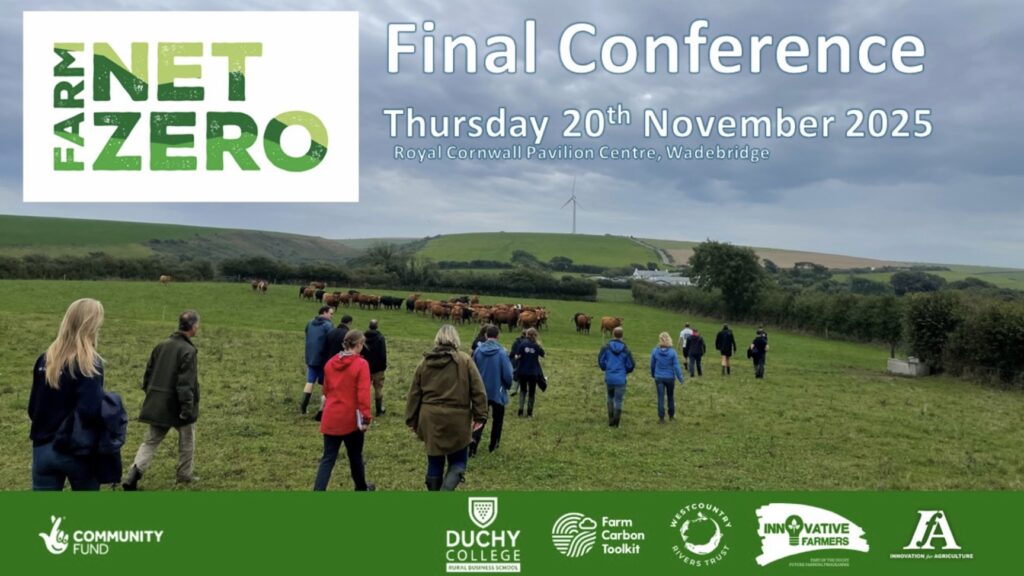
And of course, our events this year culminate in our Final Conference in November where we will celebrate the results of five years’ of Farm Net Zero. All welcome!


Recent Comments