Tag: ghg emissions

Reflections on the 7th Carbon Budget from the  Climate Change Committee

Every five years, the Committee on Climate Change (CCC)1 publishes a statutory report detailing the UK’s ‘carbon budget’ for a future five-year period. The 7th Carbon Budget covers the period 2038-2042. It is a stock-take of UK GHG emissions (current and future) and provides advice to the Government on how and where these emissions will need to be reduced (‘the pathway’) if the UK is to meet its legal obligations to reduce emissions to net zero by 2050. 

This report came out with other reports and consultations such as the Defra Land Use Framework Consultation and the IGD’s Net Zero Transition Plan for the UK Food System. Certainly how we produce food and look after agricultural land in the UK is coming more and more under the spotlight.

Within the 7th Carbon Budget report, it is good to see that the role of land use change in removing carbon is now being linked to agricultural land which gives a truer picture than was previously the case, when land use change was in a separate silo.

It is clear that the carbon budget is very high level, focussing on climate impacts only, with little reference to the impacts of the proposed changes on biodiversity across the UK’s agricultural land. In reviewing this budget, FCT has taken a very practical viewpoint and has reflected on areas where the budget could have helpfully provided more detail and looked at how to fully engage with farmers and growers across the land who are on the delivery frontline.

As other sectors decarbonise, the proportion of total emissions arising from agriculture will increase, putting more pressure on the sector to make progress on emissions reduction and carbon removals. In 2022 the contribution of agriculture to overall UK emissions was 12%. By 2040 this is predicted to rise to 27%, after the activity to reduce emissions set out in the carbon budget and it will be the second highest emitter after aviation even with the target action outlined in this carbon budget.

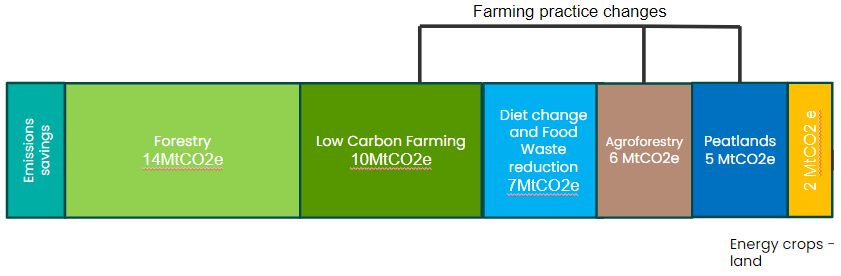
The report proposes a pathway for agriculture to reach net zero by 2050. Not surprisingly woodland creation, peatland restoration and other land use changes are highlighted as mechanisms to sequester more carbon. There is significant reliance on carbon sequestration into land sinks through the 2040’s but little reliance on any level of carbon sequestration into soil itself. 

There is a reliance on increased tree planting from the late 2020’s onwards as trees will only start to sequester larger volumes of carbon from 15 years of age onwards. According to the UK Woodland Carbon Code, sequestration rates for woodland increase dramatically during the “teenage years” of woodland establishment. In total, woodland creation has been modelled to contribute 15% to emissions reduction by 2050 . This will require an additional 1.1 million ha of woodland to be planted by 2050. In addition some 300,000 ha of lowland peat and 970,000 ha of upland peat will be returned to natural/ rewetted condition by the same time.

For agriculture the reduction in overall GHG emissions is targeted at 45% by 2050 compared to 2022, coming primarily from a reduction in livestock numbers (38% by 2050) with a relatively small contribution from the adoption of low carbon farming practices. These reductions are significant, reducing the breeding flock of sheep from 15 to 11 million ewes and the breeding cattle herd from 3 to 2 million head.

The reduction in grazing livestock numbers will release land for tree planting. The combined effect of the changes to farming practice and tree planting is to suggest that the sector will become a net sequesterer of carbon by 2048.

There are a number of important assumptions included within this budget which bear further scrutiny:

  • Crop yields will increase by 16% by 2050. Presumably this increase is deemed necessary to ensure adequate plant based foods to replace the current levels of meat in our diets. However it is questionable whether this will be achievable in practice, even if gene editing technologies are successful and fully deployed as more adverse weather events are already affecting yield levels in the UK and across the world. It is not clear how critical to successful achievement of the overall plan this is.
  • Stocking rates for grazing livestock on lowland will increase by around 10% with stocking rates in the upland reduced. Presumably the former is to allow for more land to be released to grow crops for human consumption and the latter to reflect the current over-grazing in parts of the upland and to reflect rewetting of upland peatlands and the proposals for tree planting. Targeting increased stocking rates for lowland livestock could require additional artificial fertiliser inputs which would seem counter intuitive, though the increased stocking rate could potentially be achieved through improvements in grassland utilisation efficiency.
  • Consumption of meat products (primarily beef and lamb) will fall by 35% by 2050 compared to 2019 levels. On first sight it would appear that changes in consumption are mirroring proposed reductions in livestock numbers, however, no mention is made of any changes in dairy cow numbers, but since the majority of beef produced in the UK comes from the dairy herd this will also impact milk production. Consideration is also given to replacing meat in ready meals with plant based alternatives which will negatively affect carcass balance, with lower value “cuts” often used for this purpose at the moment. This would put further pressure on sector profitability. The targeted reduction in ruminant livestock numbers would lead to a lower requirement of permanent grassland for grazing of a similar order to the reduction in livestock numbers. This would amount to around 3 million ha which could be diverted for other use, where this is possible. Tree planting would be a key use for poorer quality ground (topography and stoniness) with better quality grassland moving to arable cropping where this is possible. This would probably lead to loss of carbon from soils, especially when permanent grassland is first transitioned to arable cropping2. It is not clear whether this has been accounted for within the overall budget. 
  • The carbon budget includes a very low value (0.5Mt CO2e per year for carbon removed by grassland soils). This appears to be low and seems to take little account of the ability for well-managed livestock systems to bring multiple benefits beyond reducing emissions including carbon removals into soils and enhanced biodiversity.

    More research and data analysis is required urgently to inform us of the ability of the soil to permanently and reliably store more carbon and how best this can be done. We have some information as do others, but as yet this is not a body of evidence which the CCC can use as part of its carbon budget.
  • Returning around 300,000 ha lowland peat to a rewetted state will impinge upon its current use for growing vegetables, fruit and arable crops. The report does mention that some 10% of horticultural production will move indoors, which is likely to focus on leafy salad type crops. However for field scale vegetable production left to be grown outdoors the question remains as to where they will be grown. Moving vegetable growing to other parts of the UK will require careful site selection if current levels of margin (currently pretty low) are to be maintained and consideration of the infrastructure required, such as pack houses and cold stores.

There were also a number of notable omissions from the budget:

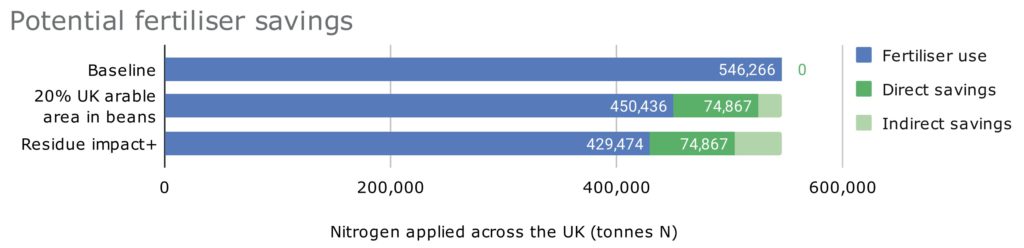
  • Whilst the pathway to reduce nitrous oxide emissions are recognised as coming primarily from agriculture, there is no mention of the need to reduce reliance on fossil fuel based N fertilisers. For arable cropping, up to 75% of total emissions arise from the production and use of artificial N fertiliser. Great work is being done to produce low carbon alternatives, but further information on the likely “winning technologies” in this space would have been helpful.
  • The level of efficiency of the UK to produce food at a lower GHG intensity than some other nations, utilising fewer arable resources (land and feed) and with lower supply chain discards through a circular feed system provides the nation with a competitive advantage in terms of overall emissions per unit of home grown food. This could be better recognised within the budget report.
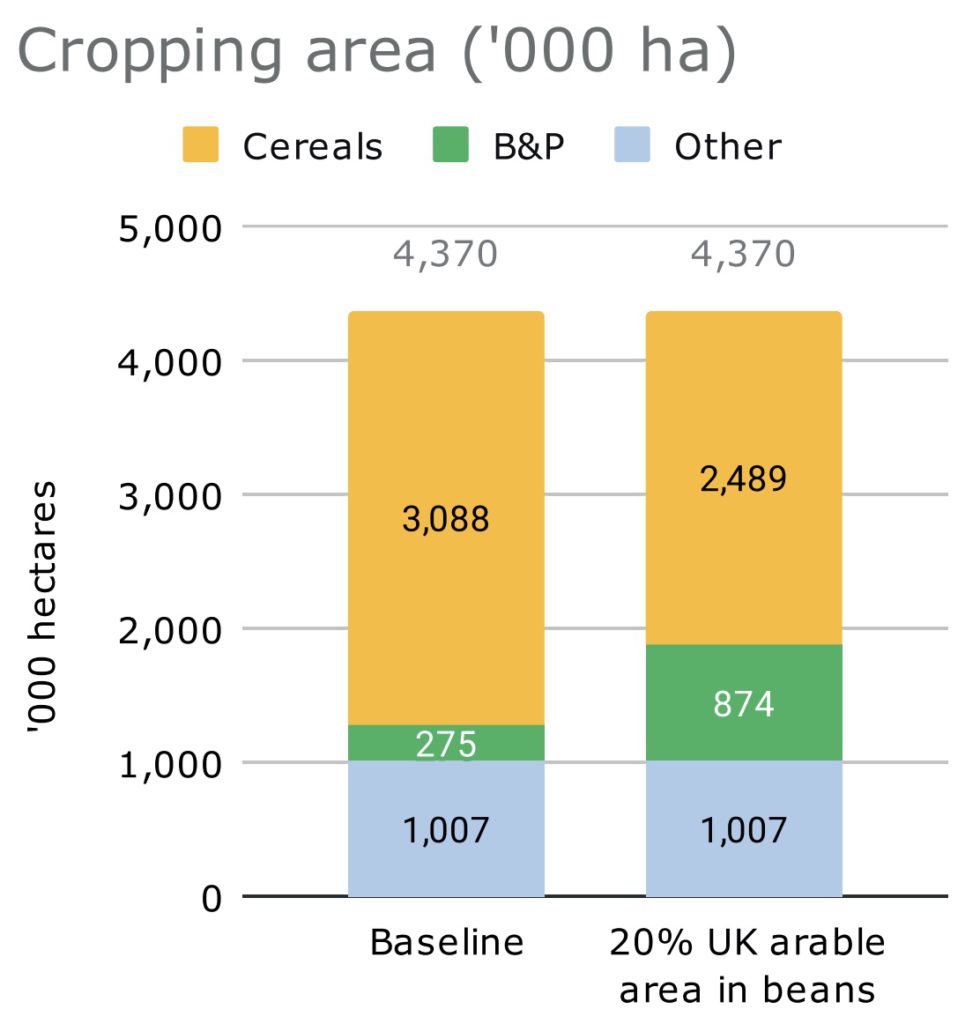
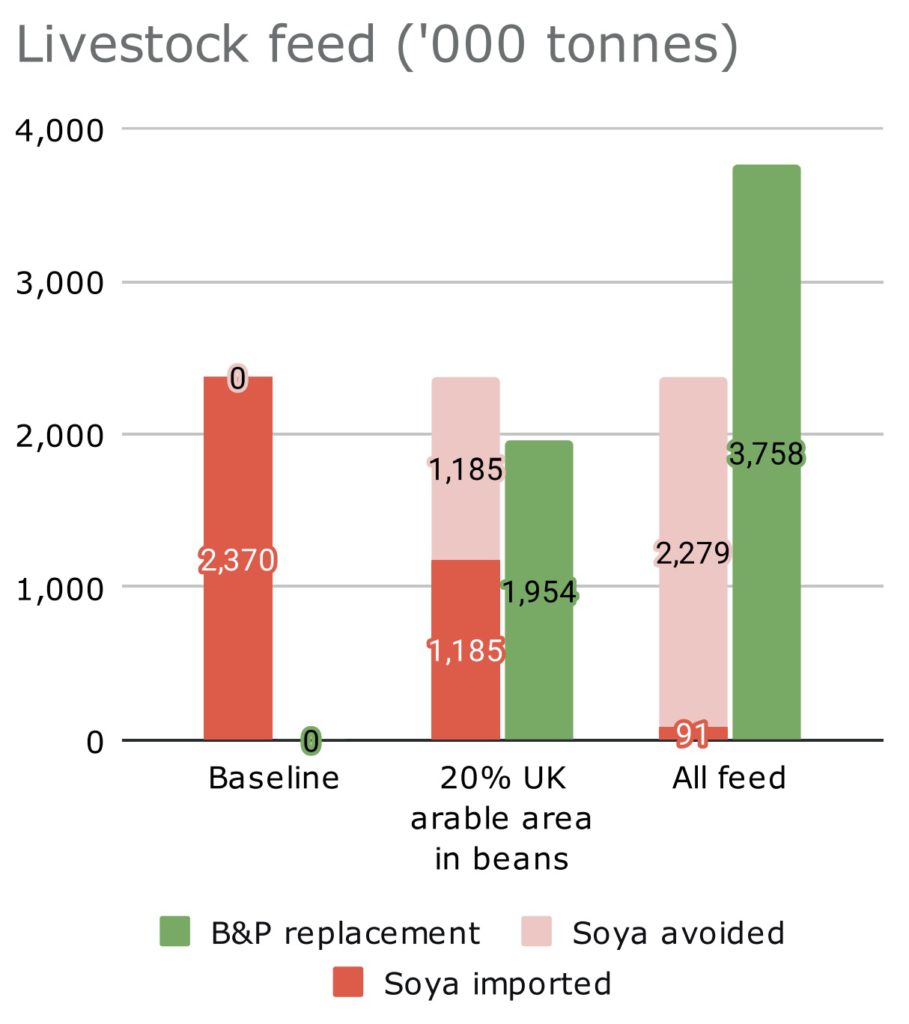
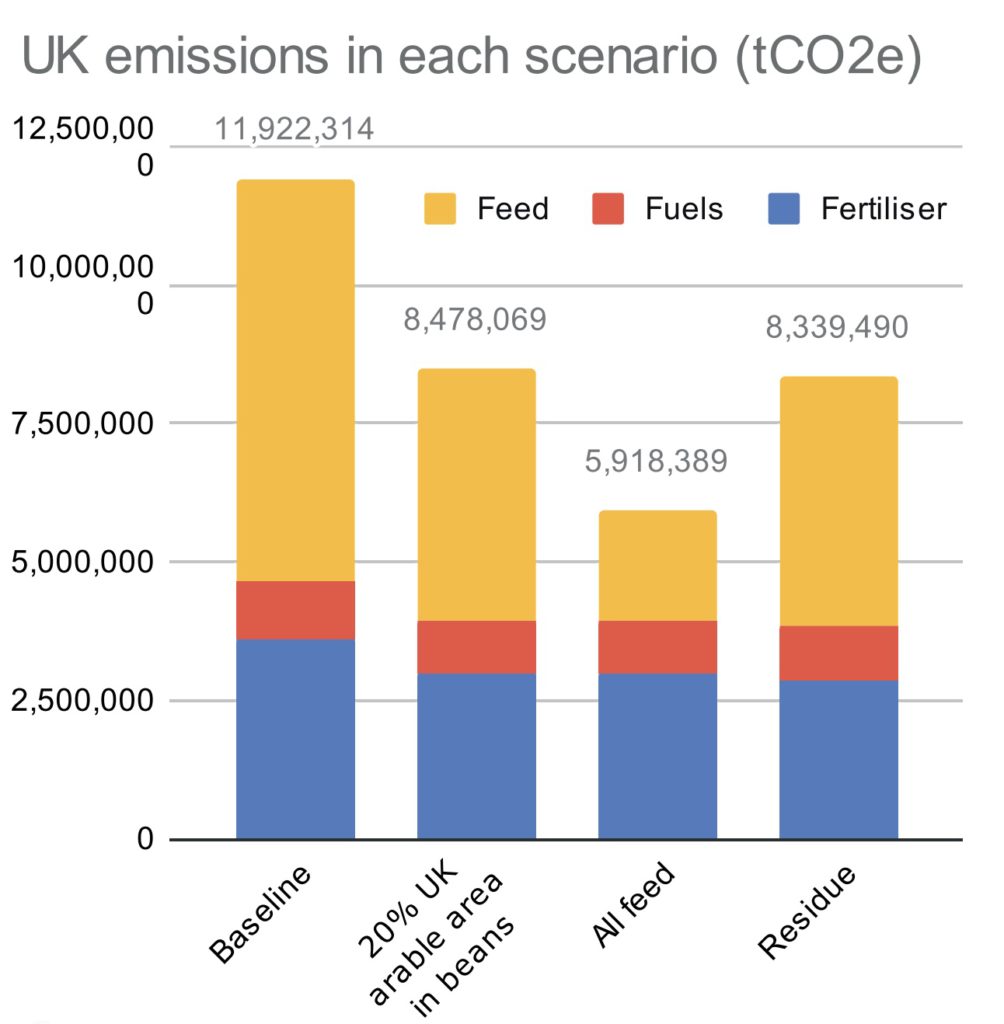
  • There is no mention of any target to reduce numbers of pigs and poultry within this 7th Carbon Budget. Whilst the animals themselves do not emit methane, their manures do and their reliance on imported soya has a significant impact on overall UK agriculture emissions as well as the soil degradation associated with cereal production to grow the cereals they wholly rely on. We have estimated that reducing reliance on imported soya by 50% and moving to feeding UK grown beans and pulses will reduce the emissions from agriculture by 7% (primarily due to reduced reliance on artificial N fertiliser and to removing deforestation emissions on 50% soya supply).

Reliance on land use change to enable agriculture to reach net zero by 2050

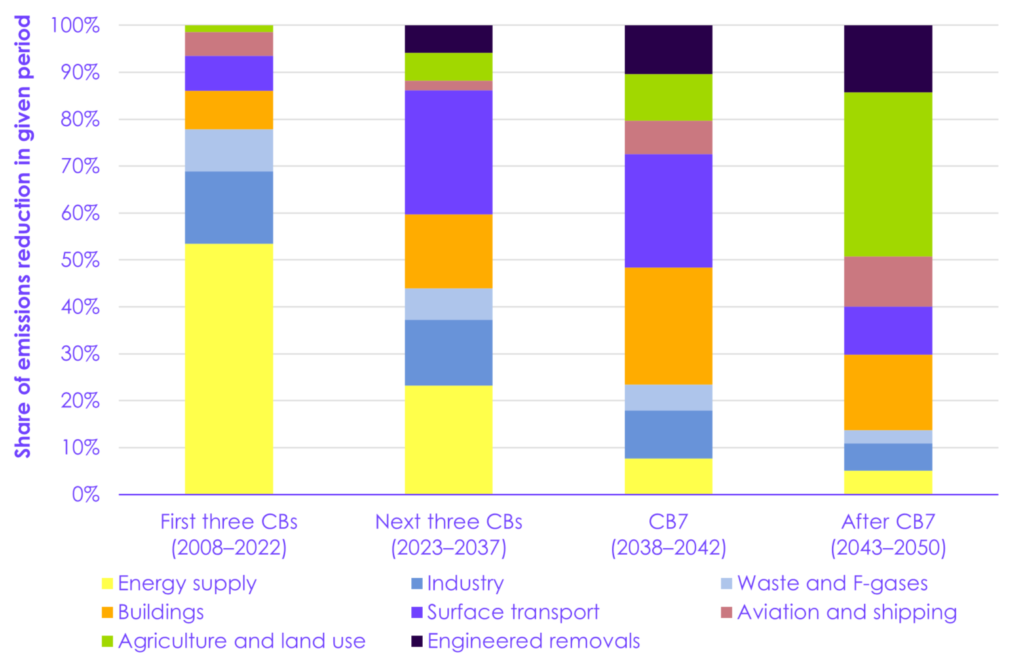
In the period from 2043-2050 agriculture and land use are budgeted to contribute the largest share of net emissions reduction (35%) – see figure 2 below from the Carbon Budget report, and to reach net zero emissions by 2050 as a result of increases in carbon sequestration into land sinks (primarily increased areas of woodland and reduced emissions from peatland due to changed management) with emissions of around 25Mt CO2e and sequestration of around 26Mt CO2e per year. Current emissions from UK agriculture are around 48Mt CO2e per year.

Distribution of emissions reductions during each carbon budget period (Climate Change Committee, Seventh Carbon Budget, 2025)

At FCT, we are in agreement with the Agriculture Advisory Group of the UK Climate Change Committee and its report in calling for more nuanced targets which better reflect the benefits of UK livestock production, especially when it is primarily based on the consumption of forages. We also agree with their view that it is important to reflect on the impact of the different gases on warming aligned to the Paris Agreement temperature goal. Both GWP100 and GWP* metrics are important and could already be reported in concert to inform on both GHG accounting (CO2e) for national inventories and impact of different GHGs on climate warming (CO2e) important for the Paris Agreement. 

We believe that the report could be much more positive about the contribution that resilient farming businesses, agricultural land and farmers can make to meeting the climate change challenge. Positive engagement and empowerment of farmers, growers and land managers are critical elements in building confidence and encouraging investment but is currently patchy, with beacons of good practice such as the Farm Net Zero project in Cornwall, which is delivering change on the ground and practically supporting farm businesses to transition towards net zero.

Footnotes

  1. A body set up to hold the government to account on their progress towards net zero and reducing emissions
  2. The UK GHG inventory suggests that the average change in non- organic soil carbon density (to 1M deep) from converting grassland to cropland in England is -24 tonnes C/ ha, in Scotland is -101 tC/ha, Wales -39 tC/ha and NI -68 tC/ha

A day in the life of… Joseph Jones, Farm Carbon and Soils Project Assistant

My name is Joe and I work at FCT as the Farm Carbon and Soils Project Assistant. I’m coming up to the completion of my first 12 months at the organisation and so it feels like a good time to reflect on what has been an exciting journey so far and what my day-day consists of. 

Beginning 

In my early days at FCT, I felt very welcomed by the team but I knew I had a challenge as I had to get to grips with many aspects of farming which I was not familiar with, coming from a non-agricultural background. I was very lucky to be able to shadow and observe different members of our knowledgeable advisor team during farm visits and soil sampling trips around Cornwall, Devon and Somerset. Although I learned many valuable things, the two most important lessons I took away were the importance of different people working together to solve the challenges that we are facing as a country, and that sometimes it’s more important to just listen to what someone wants to say than to have to say something back. 

After my initial training period, I began to conduct my own farm visits, learning more about the variety of farming systems and the people at the heart of those systems, and what their visions and worries were looking into the future. From these visits I would use our great Calculator to look through the carbon lens and see what was happening on these farms and see where the farms could get more efficient but also closer to net zero. In writing the reports and handing them back I got to see what information would be most interesting to the farmers and hopefully useful to their farm’s management decisions. Now, when I look back, I can see how much I’ve learnt, but I also know that what is left to know is endless. I think I have come to accept that, which is very liberating too.

Day to Day

My day to day is very variable, but I can summarise some key activities and projects that I work on for FCT. The main one is the incredible Connecting Constable & Gainsborough Country, one of the largest Landscape Recovery projects in England. It is a collaboration between two farm clusters in Suffolk and Essex and the Suffolk Wildlife Trust. Most of my time is spent conducting farm visits, understanding the farmer’s system and motivations, processing the data , and then writing the reports and handing them back to the farms involved. 

Another exciting but more hands on project I assist with is the England Ecosystem Survey (EES). The largest survey ever conducted in the UK, me and my colleague Jemma have visited some beautiful sites in the West Country to collect soils following the detailed protocol set by Natural England. Once the data has been gathered and analysed we will have the most comprehensive set of soil dataset covering England.  Lastly, the final project I am involved with is CHCx3. This is an exciting collaboration between agricultural and industrial partners to develop and explore more diverse crop options for greater carbon sequestration and reduced GHG emissions. FCT is supporting the project with its soil sampling aspect, co-ordinating with our project partners to examine soil carbon patterns underneath these crops and footprint the farms involved. 

Outside of these core activities, I get to participate with some of the great events we put on, including Soil Farmer of the Year, Carbon Farmer of the Year, our Field Days and our staff Away Days, all of which are fun and interesting. 

Exciting Future

Although there seems to be constant news stories about setbacks in environmental and human health, in the projects I work on for FCT I do feel like I can see the positive changes beginning to take shape more and more. There is a growing demand for a healthier lifestyle and the systems that support it as well as a more harmonious relationship with our environment and the creatures in it. One of the most satisfying aspects of my role, alongside the skills and experiences, is the fact that, in my small way, I hope I am playing my part in supporting this change. I feel very lucky to have that opportunity. 

A day in the life of… Grace Wardell, Calculator Development Officer

I’m Grace, one of FCT’s Calculator Development Officers. If you haven’t heard of FCT or our Farm Carbon Calculator, that job title probably means very little to you! So, let me explain what I do on a day to day basis to help maintain running one of the UK’s top 3 farm carbon calculators.

The Farm Carbon Calculator is just one branch of FCT’s work and is a tool within our online toolkit. Working within our Calculator team, my role is to ensure the Farm Carbon Calculator is based on rigorous science, remains up-to-date with standards and guidance, and is free of bugs that can sometimes appear when running a software.

To achieve these aims, I am regularly undertaking research, particularly if someone has requested an item on the Calculator, like a specific fertiliser or crop. I will find associated emissions factors, consult with experts in the field, alongside standards and guidance to ensure we are employing the recommended calculations.

Each year we undertake two major updates, one in April where we assess and update all emissions factors and one in October where we also look to improve the functionality of the Calculator. These are busy times for our team, where we work through and update thousands of line items on the Calculator to ensure we remain up-to-date with the latest science and data that’s available. All the while, I work alongside Lizzy Parker (Calculator Manager), James Pitman (Calculator Development Officer) and our software developers to keep the website running smoothly. 


Aside from my core work on the Calculator, one of the exciting things about working for FCT is the breadth of interesting projects we are involved in. I have undertaken farm modelling work for a few different projects looking to model the transition to more regenerative practices and the impacts that may have on greenhouse gas emissions. I regularly go to farming conferences to hear firsthand the issues that farmers are facing and can offer free advice on carbon footprinting their farm. I get to brush up on my science communication skills when posting blogs on our website on hot topics. I also get to enjoy our in person events such as our Annual Field Day, Soil Farmer of the Year and Carbon Farmer of the Year events, where we champion pioneers in sustainable farming.

Since we all work remotely and are spread far and wide across the UK, it is these in-person events and our Away Days that remind me how lucky I am to work with such passionate people who care immensely about our farmers, our environment and our food production systems.

How Introducing Pulses into UK Arable Crop Rotations Could Reduce Emissions

Agricultural emissions could potentially be reduced by 3.4Mt CO2e by replacing half of soyabean meal in livestock feed with homegrown pulses as a result of reduced deforestation and land use change, lower synthetic fertiliser use and fuel savings. We are delighted to share more detail with you here.

In 2023, only 6.3% of the UK’s 4.3 million hectares of cropping land grew beans or pulses. These crops have significant agricultural potential; offering soil health benefits, livestock feed options, and alternatives to currently stressed rotations. The NCS project hopes to harness this potential by expanding the pulse cropping to 20% of the total arable area in the UK. This would involve increasing the annual area of beans and pulses grown from 275,090 ha’s (6.3%) to 874,026 ha’s (20%).

The impact of expanding pulse cropping

Expanding the pulse cropping area will result in GHG emissions reductions in the areas highlighted
below:

  • Reduced fuel usage
  • Direct fertiliser avoidance
  • Indirect fertiliser avoidance as a result of leguminous residues
  • Providing a low emission feed alternative to imported soya

Reducing fuel usage

Growing and harvesting pulses requires less fuel than growing cereal crops. FCT modelling on the operations needed to grow cereals indicates that 91 litres of diesel/ha is required, compared to 84 litres/ha to grow beans and pulses. This reduces emissions by 37,524.09 tCO2e when scaled out across the UK arable area.

Reducing fertiliser reliance

Growing pulses like peas and beans reduces reliance on synthetic nitrogen fertilisers both during the pulses cropping year and for subsequent crops, as these plants fix nitrogen into the soil. In 2023, the UK applied an average of 125 kg N/ha of fertiliser, totalling 546,266 tonnes and emitting 3.6 MT CO2e. By expanding pulse cultivation, the UK could save 74,867 tonnes of nitrogen fertiliser annually, directly avoiding 494,925 tCO2e emissions. Moreover, pulse residues can enhance nitrogen availability for subsequent crops, amounting to 35–70 kg N/ha (depending on soil conditions etc.). This could save an additional 20,963–41,926 tonnes of nitrogen annually across the UK, equating to 138,580-277,160 tCO2e.

Substitution of imported soya feed

In 2023, the UK imported 2.37 million tonnes of soya feed, 74% from South America, resulting in 7.3 MT CO2e emissions. UK grown beans could replace some of this soya, substantially reducing the footprint of animal feed. If all UK grown beans within the scenario proposed by NCS were used within compound feeds and straights, they could replace 96% of soya imports, avoiding 5.3 MT CO2e.

A more realistic scenario is replacing 50% of imported soya with 1.95 million tonnes of UK
beans, requiring 454,468 hectares (52% of beans/peas cropping area). This would cut
feed emissions to 4.5 MT CO2e, saving 2.8 MT CO2e compared to current levels of soya imports.

Conclusion

The expansion of beans and pulses to cover 20% of the UK cropping area could save 3.4
MT CO2e (equivalent to 7% of UK agriculture’s total emissions). This would increase if more
of the beans and pulses grown could displace imported soyabean meal.

Sources:

  • Fertiliser data from the British Survey of Fertiliser Practice, 2023
  • Land use data from DEFRA land use and crop areas 2023
  • Fuel usage based on FCT modelling of the field operations
  • Soya imports from EFECA and UK soya manifesto, 2024 progress
    report
  • Protein content: Johnston et al, 2019 https://doi.org/10.1016/j.
    livsci.2018.12.015

Groundswell reflections: how close can agriculture get to being carbon positive?

Groundswell

by Liz Bowles, CEO

Groundswell this year was as exciting as ever, with so many excellent sessions and people to catch up with and meet for the first time. 

There was much interest in how farmers and growers can benefit from the new markets for carbon, biodiversity net gain and nutrient neutrality to name but three, but to my mind, there was far less attention on how the sector can actually reduce the emissions associated with producing food itself.

For me, this is critical as we have to find a way to reduce the greenhouse gases we push into our atmosphere, as well as removing some of the historical emissions already there, if we are to reduce the worst impacts of climate change.

There is, however, a central question for our food system which is: What level of emissions are inevitable from the production of food which is essential for humanity? The Climate Change Committee has come up with a view on this in their 2020 UK agricultural policy for net zero report, which suggests a road map for saving 64% in the annual emissions from agriculture compared to 2017 levels when UK agriculture was responsible for around 58 MtCO2e (12% of total UK  emissions). On closer inspection of the figures though, the actual savings in emissions from agriculture are set at around 21 MtCO2e / year, with the remaining savings to come from forestry, changes to our diet and the production of energy crops instead of food.

This is set out below:

The specific actions suggested for each of these areas are set out below:

  • Tree planting on 30,000 hectares per year
  • Use 10% of UK farmland  for agroforestry (no distinction made between agroforestry and hedgerows)
  • Restore at least 55% of peatland area by 2050. (For lowland peat lands this means rewetting or paludiculture to reduce emissions and for uplands this means rewetting).
  • Increases in low-carbon farming practices for soils and livestock (no detail provided)
  • Increase the area of farmland devoted to energy crops to 23,000 ha per year

From this list, the low carbon farming practices interest me in terms of how their adoption will enable an annual reduction of 10MtCO2e per year to occur (~25% of 2022 UK agricultural emissions). At Farm Carbon Toolkit we work directly with farmers and growers to adopt these practices and changes to current management processes. Typically the areas to focus on include:

  • Planting cover crops
  • Changing crop rotation
  • Transitioning to no/min till where possible
  • Growing new crops
  • Integrated pest management
  • Adopting rotational grazing
  • Planting herbal leys

Across all these practices, there should be a focus on reducing the use of artificial nitrogen fertilisers and purchased livestock feed (especially those including imported ingredients) as both these inputs carry a high level of associated emissions.

Many of these practices can also be considered to be part of the suite of “regenerative farming principles”. Adoption of more regenerative farming practices is growing steadily, but for many farmers, the key question surrounds the financial viability of their adoption when margins are so tight. A recent report commissioned by the Farming for Carbon and Nature Group and funded by the Natural England Environment Investment Readiness Fund (NEIRF) sets out the financial and climate impact of adoption of more regenerative farming practices and systems and includes partial budget information on the financial impact of adoption in England with support from SFI where relevant.

Regenerative farming practices and their financial viability, including external support available in England, where available

This chart clearly shows that with the inclusion of SFI support, many of the practices generally considered to be regenerative are likely to deliver a similar margin than more conventional practices in these areas. The area where more support is needed is in the adoption of more complex arable rotations including pulses and fertility building leys, where even with appropriate SFI payments, the margins from shorter more degenerative rotations are likely to be more profitable. We are a member of the Nitrogen Climate Smart Consortium which is supporting the increased production of pulses and legumes in the UK together with their use as animal feeds to address the need to reduce the use of artificial fertilisers and imported animal feedstuffs. This project will support farmers to do this through farmer field trials as well as the introduction of new technology for on-farm pulses processing.  You can find out more about this project and get involved by following this link.

In summary, I am fairly confident that UK agriculture can reduce greenhouse gas emissions by at least 10% through the adoption of low-carbon farming practices. Indeed through some of the practical work with farmers in which FCT is involved, we are seeing higher levels of emission reductions being achieved within businesses with little or no change in farm output and in many cases increased profitability and business resilience. The element which is mostly missing is the confidence and knowledge to make the necessary changes and knowing where to start.

At FCT we provide a (free for farmers and growers) Farm Carbon Calculator to allow businesses to understand their starting point, a set of tools within our Toolkit to assist businesses to make those chances and a team of expert advisors to talk to.

You can always make contact with us by email [email protected] or by calling us on 07541 453413. We look forward to hearing from you.

Harmonisation of Carbon Accounting Tools for Agriculture – Webinar Replay

Watch a replay of this webinar held on the 11th September 2024 where representatives of the three major farm carbon calculators shared more details of the work they are doing together: Work to support UK agriculture to measure GHG emissions using the most up-to-date and accurate tools possible, harmonising the methodologies and outputs of their carbon calculation tools.

The three major farm carbon calculators featured in the Defra Report Harmonisation of Carbon Accounting Tools for Agriculture – SCF0129 who were Farm Carbon Toolkit, Cool Farm Alliance Community Interest Company and Agrecalc Limited – announced a collaboration earlier in 2024 by signing a Memorandum of Understanding (MOU), intended to harmonise the methodologies used in calculating the greenhouse gas (GHG) emissions from agriculture.

….. more webinar information to follow soon …..

Webinar Q&A

We received a great list of questions during the webinar event and teams from the various calculators will look to address those queries in due course.

Media contact: Kandia Appadoo ([email protected])


Three major farm carbon calculators outline a roadmap to harmonisation

The three major farm carbon calculators featured in the Defra Report Harmonisation of Carbon Accounting Tools for Agriculture – SCF0129 have announced a collaboration by signing a Memorandum of Understanding (MOU), intended to harmonise the methodologies used in calculating the greenhouse gas (GHG) emissions from agriculture.

Farm Carbon Toolkit, Cool Farm Alliance Community Interest Company and Agrecalc Limited have reached an agreement to work together to support UK agriculture to measure GHG emissions using the most up-to-date and accurate tools possible, harmonising the methodologies and outputs of their carbon calculation tools.

The three companies are looking forward to their joint work on this major challenge, to fulfil the requirements outlined in the comprehensive Report, compiled by ADAS throughout 2023. It is generally agreed that the overarching goal should be to reduce the overall greenhouse gas emissions  from agriculture through resource efficiency improvements,  optimising production practices and mitigating environmental impacts.

Liz Bowles, Farm Carbon Toolkit CEO, said:

We are not seeking to reach a point where all three calculators will produce the same answer for any given dataset. As the Defra report put it, “ there is no single ‘right’ answer”. Rather we are striving to make it possible for users to fully understand why different calculators produce different answers.

We plan to align with the Science-Based Targets initiative Forestry Land and Agriculture Guidance (SBTi FLAG) and draft Greenhouse Gas Protocol Land Sector Removals Guidance (GHGp LSRG) through our collaborative actions. This commitment underscores our dedication to maintaining high-quality standards and ensuring environmental sustainability in our operations, and in calculation outputs.

Scott Davies, Agrecalc CEO, said:

It is intended that we agree on a common set of data sources which all three calculators will use. All calculators can go beyond these baseline requirements, and all parties to this MOU will retain their commercial independence. We will also involve the relevant government and other organisations’ teams with our work plan as we develop it.

This collaborative approach supports a joint understanding of industry requirements and advancing consistency in our tools and methodologies. Our goal is collaboration with industry, trade bodies, and fellow calculator providers in the UK and internationally, so that we can actively contribute to the development of more consistent approaches to on-farm carbon calculation.

Richard Profit, Cool Farm Alliance CEO, said:

We are looking forward to this collaboration, as it will help align methodologies where that makes sense and that will especially allow us to look into new areas that require attention. How we then incorporate the new information in our calculators will vary from calculator to calculator as a result of our different base approaches.

We will also ensure that the tools include the latest and most robust scientific findings into their frameworks and roadmaps.

The calculators are seeking that this joint work become the “agreed way” and at some point, become a minimum required standard for all calculators to adopt. The companies will engage in consultations with Defra, Welsh Government, Scottish Government, and Northern Ireland Government to reach a practical and realistic form of ongoing validation of their harmonisation work.

Methodologies or other harmonisation solutions developed as a direct result of the MOU will be published transparently, or will otherwise be made available for others to use.

Although this MOU currently only involves the three major companies in this space, the group is open to other calculators joining the coalition so long as they publicly provide transparency in their Calculator methodologies. 

We will be holding a joint webinar on the 11th September 2024 at 1pm – 2pm to share more details of the work we are doing together. Please register here if you would like to join us

Notes to Editors

Farm Carbon Toolkit is an independent, farmer-led Community Interest Company, supporting farmers to measure, understand and act on their greenhouse gas emissions, while improving their business resilience for the future. 

The Farm Carbon Calculator uses the IPCC 2019 and UK GHG Inventory methodologies and is aligned with the GHG protocol agricultural guidance. Recent development has allowed us to provide greater interoperability with other data platforms through our Report Export API and Carbon Calculation Engine API. This represents a step-change in the industry’s ability to provide trustworthy carbon footprints with transparent methodologies on platforms where farmers already collect data, thus reducing the data inputting onus on farmers. This new functionality has been warmly welcomed by supply chain businesses who are now using our Calculation Engine to support their customers without need for further data entry. 

The Farm Carbon Calculator is used across the UK and on four continents with global usage growing at around 20% per year. 

For over a decade, Farm Carbon Toolkit has delivered a range of practical projects, tools and services that have inspired real action on the ground. Organisations they work with include the Duchy of Cornwall, First Milk, Tesco, Yeo Valley and WWF. The Farm Carbon Calculator is a leading on-farm carbon audit tool, used by over 8,000 farmers in the UK and beyond. To find out more visit www.farmcarbontoolkit.org.uk 

Media contact: Rachel Hucker ([email protected]; 07541 453413) 

Agrecalc, a carbon footprint tool developed by combining practical expertise with world-class agricultural science, is a precise instrument that offers both breadth and depth of on-farm and through-the-supply-chain calculations of GHG gas emissions.

Agrecalc is the largest source of collated farm benchmark data from thousands of farms, having been used as the designated tool to deliver carbon audits under various schemes since 2016. It is recognised as the preferred carbon calculator in many of the emerging government programmes.

With a mission to increase efficiency and business viability of food production, the scientists, consultants, and developers who work on Agrecalc, strive to constantly upgrade the calculator according to the most up-to-date available research results and recommendations.

Media contact: Aleksandra Stevanovic, Head of Marketing; ([email protected]; 07551 263 407)

Cool Farm Alliance Community Interest Company is a science-led, not-for-profit membership organisation (community interest company) that owns, manages, and improves the Cool Farm Tool and cultivates the leadership network to advance regenerative agriculture at scale.

For over fifteen years, the Cool Farm Alliance has worked to put knowledge in the hands of farmers and empower the full supply chain to understand and support agro-ecological restoration by providing a respected, standardised calculation engine to measure and report on agriculture’s impact on the environment. The Cool Farm Tool has established widely endorsed, science-based metrics for water, climate, and biodiversity, supported in 17 languages and used in more than 150 countries around the world.

Cool Farm Alliance members share the need for a respected, consistent, standardised, independent calculation engine and have joined the Alliance to ensure the Cool Farm Tool meets this need, now and in the future.  To find out more visit https://coolfarm.org/

Media contact: Kandia Appadoo ([email protected])

What are Dung Beetles?

Dung beetles are fascinating creatures that play an essential role in breaking down dung, reducing greenhouse gas emissions and providing vital ecosystem services such as improving pastures, conditioning soils, and reducing parasitic burdens on our livestock. 

What are the types of dung beetle?

There are three basic groups of dung beetles: dwellers, tunnellers, and rollers. Dwellers live and reproduce within the dung, tunnellers create channels underneath the dung pat pulling dung through the soil and storing within the tunnels to eat and lay their eggs, rollers roll dung balls away and bury them underground.

Where can you find dung beetles?

Dung beetles are found on every continent except Antarctica. Their habitats range from desert to farmland to forest, owing their entire existence to dung from an equally wide range of animals. You’ll find most dung beetles in or around dung pats from herbivores that typically pass undigested plant material as well as liquid. Adult dung beetles tend to feed on the more liquid portion of the dung pat and dung beetle larvae will feed on the more solid portion. Hence, it’s important for the animals depositing dung to have a diet containing lots of fibre.

Dung beetles in the UK

There are around 60 species of dung beetle in the UK belonging to the tunneller and dweller groups – rollers are found in the warmer climate of the southern hemisphere. Some dung beetles are active during the day whereas some fly at night. Just like humans, dung beetles have preference when it comes to sniffing out food (dung). Some prefer dung from specific animals, some prefer dried dung as opposed to fresh and some are even picky when it comes to the location of dung within a field, however, mostly are generalists and will reside in any they can find.

What are the benefits of dung beetles?

It has been suggested that dung beetles can save the cattle industry around £367 million a year.

How?

Firstly, they increase soil nutrients. Fresh dung contains nitrogen, potassium and phosphorous; dung beetles eat, bury, and release these nutrients for the benefit of the surrounding soil biology, improving soil fertility and soil structure through channelling and drawing down organic matter. This can reduce reliance on fertiliser and makes much better use of our manures.

Secondly, dung beetles reduce pasture fouling. When dung isn’t removed from the field, the grass underneath it will die and the grass surrounding it will be unpalatable to livestock. If you scale this up, it removes a huge area for grazing as well as wasting an abundance of nutrients.

Thirdly, dung beetles are excellent at reducing pest flies from the activities of mites which are transported on the beetles’ bodies. The value of these organisms can be identified through reduced parasites on your livestock that ultimately impact milk yield and liveweight gains due to energy expended by the livestock to defend themselves or fight against infection. In both cases, dung beetles reduce survival of flies and parasites through competition of resources. 

Why are dung beetle populations in decline?

Unfortunately, despite the benefits of dung beetles, they are in decline due to the intensification of livestock systems – use of pesticides and anthelmintics. During the grazing season, dung pats could be broken down in a matter of days but instead, many lie rotting for a long time (and producing more methane emissions).

How can we encourage dung beetle populations?

Provision of dung is vital. If we’re able to outwinter even a fraction of our stock it provides a food resource all year round, attracting a more diverse array of dung beetle species.

Feeding livestock a more fibrous diet i.e. moving away from a grain-based diet can also help as it’s important to provide that partially undigested fibrous material.

Finally, long-acting anthelmintics can cause catastrophic loss of dung beetle populations. With veterinary support, frequent weighing of livestock and spot-treating animals  offers a more sustainable way of reducing anthelmintic use, reducing the wormer-resistance in intestinal parasites, and protecting dung beetle populations. 

How can we find out more about dung beetles?

There’s a wealth of information online about dung beetles, but to really get down to the detail, Farm Carbon Toolkit  is holding a two-day conference, in partnership with leading vets, dairy cooperative First Milk and Somerset dairy company Yeo Valley, on Tuesday 11 and Wednesday 12 June at Yeo Valley’s Holt Farm near Blagdon, south of Bristol. Event details and registration can be found here

How to avoid ‘double counting’ your carbon

Carbon accounting is a fast-moving space, and here at FCT, keeping on top of best practices is one of our top priorities. We commission regular external reviews of all our emissions factors to make sure we’re as compliant and up-to-date as possible. And yet even with the best data available, there’s always the possibility of human error (we all do it!) cropping up in a carbon report. 

One area we’re particularly keen to address is how to avoid ‘double counting’ when it comes to farming footprints. This refers to counting the same carbon/CO2e in different places, often (but not always) in the same report. 

For example, you might record all your freight and logistics fuel use in the ‘Fuels’ section of our Calculator, only to duplicate the entry under the ‘Distribution’ section. This would result in counting the same emissions twice, artificially inflating the total emissions figure. 

These errors can be subtle and easy mistakes to make, so it’s worth reading on to find out how to avoid them and embrace best practices.

How is double counting possible?

Our Carbon Calculator has many different emissions factors that you can record, reflecting the wide variety of needs and business profiles in modern farming. Because of the need for informative metrics and KPIs, our Calculator sometimes offers the option to record an emission or offset in more than one section. 

You can therefore choose to either record all of the carbon in one section, or to split it out for better insight in your final report. For example, you may want to be able to see the amount of fuel used in farming operations vs. the fuel used in the distribution of goods. Being able to record the carbon in more than one place is crucial to business insight, but it does introduce the risk of error. 

If we want to use these informative metrics, then it’s important to be aware of when you might double-count your carbon. 

Where in the Calculator might I be double counting?

We’ve listed below some of the most common areas where double counting may occur in our Calculator. For each one we’ve given an example of how it occurs, and the best practice in order to avoid it. 

Animal Feeds – Home grown vs. Bought in 

If you are growing your own animal feed on-farm, then you don’t need to account for this in the ‘Livestock’ section. To do so would overestimate your emissions. The Livestock section is only for feeds that are specifically bought in.

To avoid the double count: Make sure that anything recorded as a feed in the Livestock section is a bought-in feed. If not, it doesn’t need to be counted there!

Materials vs. Inventory

The Materials section of our Calculator allows you to record a wide variety of items that are used in construction and repair work. Our Inventory section, on the other hand, is there to record larger capital items such as new outbuildings or farm machinery. This difference is key, as any items within the Inventory section will have their carbon impact depreciated over a period of 10 years.

It’s also possible to record your own custom building projects inside the Inventory section. For example, you might choose to record all the materials associated with a new outbuilding. This might be done so that you can achieve a more precise footprint for a non-standard construction. 

Where materials are purchased for running or regular repairs of existing installations, record these in the Materials section.

To avoid the double count: Make sure you’re not recording any custom-build projects in both Materials and Inventory. They only need to be recorded in one of these sections!

Sequestration – Double Counting Offsets 

If you have previously sold any carbon offsets, for example through soil organic carbon sequestration, then you should not count the offset in your report. To do so would be an example of double counting as the benefits are no longer attributable to your farm business. 

To avoid the double count: Make sure you’re only recording potential sequestration that hasn’t been sold or accounted for elsewhere. 

Sequestration – Double Counting potential sequestration

If you have entered an area of land under the sequestration option: “Soil Organic Matter” or “Soil Organic Carbon” (using information from soil sampling), you should not also enter those areas of land under other sequestration options (such as Countryside Stewardship Schemes, even if the land is receiving payment for that scheme). Direct soil sampling is preferable in this scenario. Similarly, whilst in practice you can “stack” the payments you receive from stewardship grants, you must only enter areas of land for sequestration under one potential sequestration option (so if “My field” is 5ha, I can enter soil sampling data from those 5ha OR the fact that they are under a Countryside Stewardship Scheme).

To avoid the double count: Include each field area under only one potential ‘Sequestration’ option.

Fuel Use – Distribution vs. Farming Operations 

If you want to split out your fuel use into distribution and farming operations, you have the option to record these separately. Any farm fuel use such as red diesel can be recorded under ‘Fuels’. Any fuel used in moving goods can be put under ‘Distribution’. 

To avoid the double count: We recommend splitting out fuel use between ‘Fuels’ (i.e. farm operations) and ‘Distribution’.

The Exceptions

As with all good rules, there are some apparent exceptions:

  • you CAN add multiple crops that have been grown on the same area of land in the same year (but only include those that have been harvested or terminated within the reporting period). 

A Day in the Life – Michael Brown, Calculator Customer Service Officer

A little challenge every day

Chances are, if you’re interested in measuring the carbon footprint of your farm you know a bit about what my job entails. I’m here to support you and help more and more farmers measure the carbon footprint of their farm. Each day, I’m immersed in both the challenges and rewards of what this involves:

We get it – carbon footprinting a farm can be hard, every farm is different, time is short and sometimes we all face problems fitting the farm information we have into an online carbon calculator.

Rising to the challenge

Behind our calculator is an approachable team who benefit from a two-way process where we help you and the more we do this, the more we learn and can improve the calculator in the long term.

We put together online resources; we generate and record ideas which guide ongoing research into methodologies of calculating GHG emissions in agriculture; and we contribute to the development and testing of our software.

When we develop, and when we test – we’re looking to see if things are getting better – and since starting in April 2024 we’ve already seen some great improvements rolled out to the calculator. My role contributes toward this on an average day.

Starting the Day: Checking in with the users

The day kicks off with a review of support requests from users across the UK and farms around the world. Our users vary widely, from small family farms to large agricultural enterprises, and their technical needs are just as diverse. Questions cannot be predicted but range from understanding how to input specific data into the calculator to interpreting their carbon footprint results.

I love interacting with those farmers taking the important step of calculating a footprint. There are many reasons for doing this – and all are inspiring, so it is great to hear from those involved. By solving problems or helping guide users my small but crucial role builds our understanding of carbon data. 

Mid-Morning: Developing resources for sustainable agriculture

A big part of my role is creating and updating online resources that help users maximize the calculator’s potential. I’ll work on developing these resources – which you can view in our FAQ’s, downloadable resources, instructional videos, or during training sessions. 

We think many farmers work long hours and appreciate a well-organized, easy-to-navigate guide that helps self-starters make the most of the Calculator – we believe it should be possible to use the tool yourself and feel that satisfaction of having achieved something.

Afternoon: Finding a solution for businesses or environmental professionals

The afternoon usually involves working closely with our Calculator Manager and other team members to ensure the Farm Carbon Calculator continues to deliver for our professional and commercial users. 

We rely on the legion of professionals, organisations, and partners who pay to use our software through licences, our excellent API, or in other ways to reach ever more farmers. Their fees support the work we do in all senses and this is clear in all our approaches to commercial work.

Staying informed in this area is critical for our relevance as the opportunities for us to help those working in carbon management and agricultural sustainability are constantly evolving.

With Lizzy Parker, Calculator Manager, at FCT’s Annual Field Day 2024

Wrapping up: Reflecting on progress and user feedback

Toward the end of the day, I might be reviewing feedback from users on recent updates or features, and discussions from the morning. Positive feedback is always motivating, and constructive suggestions are tracked to help us improve.

Without farmers and others working hard on their footprints and their sustainability I either wouldn’t have a job, or wouldn’t have the inspiration to know what to do next. With that in mind – throughout the day you can reach me at the end of the phone or on email – so give me a call. 

If you are an agricultural professional or large organisation you may want to see the services available for you, book a demo with us, or let me know if you want to learn more. Everyone else using the tool – just get started, create an account, or get in touch. You can reach us Monday to Friday 9am to 5pm on [email protected]