
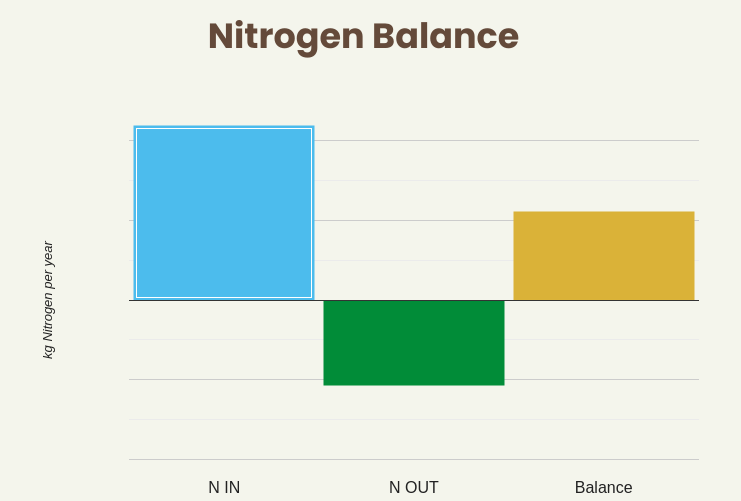
In the face of rising fertiliser prices and environmental concerns, it is crucial to optimise nitrogen use efficiency, NUE, in agriculture. Nitrogen is a key nutrient for crop growth, but on average, only 60% of applied nitrogen is effectively used, while the remaining 40% is lost to the wider environment. This leads to both economic loss and adverse environmental impacts, such as loss of plant ecosystem diversity and waterway contamination.
Reducing reliance on the use of artificial (fossil fuel based) fertilisers is one of the key ways in which all farmers can reduce their farm carbon footprint. Hence finding ways to improve NUE is critical.
How do we go about improving our use of artificial inputs?
1.Improving fertiliser management
The first step in fertiliser management is working out the requirements. Oversupply of nitrogen has many unintended negative consequences:
- Reduces soil pH
- Reduces soil organic matter
- Reduces soil health
- Increases nitrogen leaching, run off and volatilisation.
Fertiliser uptake is most efficient when the right quantity is supplied at the right time , i.e. when the crop can take it up. Regular soil testing and analysis can provide an accurate picture of the chemical composition, providing soil indices for P, K and Mg in line with RB209 and soil pH. The results from soil testing will be dependent on the legacy effect of previous crops, management and soil type. Standard soil testing does not measure nitrogen content.
Soil nitrogen supply (SNS) index is used to describe the levels of available nitrogen in the soil. Through measuring the quantity of available nitrogen within the soil, the suggested nitrogen requirement from artificial fertiliser may be reduced due to the supply from the soil alone. Different crops have different nitrogen requirements which are outlined in RB209 with respect to the SNS. These tools can be used to calculate the economic optimum for fertiliser application on each crop. Alongside fertilisers, optimising pH is critical for most crops to make best use of any fertiliser applied – for most crops it is pH 6.0 – 6.5. Agronomists or FACTS qualified advisors are a good source of fertiliser information and advice.
Timeliness of applications is also an important consideration with split applications being the best way to target the most significant growth periods. Applying nitrogen to a growing crop reduces losses as uptake is at its maximum. With the cost of applications there is an optimum balance for the number of applications on the crop.
Weather is perhaps the biggest determinant of when fertiliser can be applied. The target conditions for soil applied fertiliser are a cool temperature with moist soil. Climate change is becoming a growing threat with more extreme and unpredictable conditions becoming more regular.

Tools to measure Nitrogen
- Soil Mineral N testing in Autumn or Spring measures plant available nitrogen allowing the grower to adjust the rate of applied nitrogen. This should be done per field and soil type across each field.
- Chlorophyll N Tester can be used every 7 – 10 days in most crop types once full leaf ground cover is achieved. e.g. Yara N – Tester
- Chlorophyll N Sensor mounted on the tractor roof is linked to a variable rate fertiliser spreader or sprayer. Trials have shown a saving of 50 kg of N on wheat is possible.
- Sap or leaf testing can also be used to measure N in a growing crop.
- Testing grain and straw for cereals for N and S will allow an accurate budget for N removed and whether there is adequate sulphur which is essential for efficient uptake of N, it will also tell you if you have put too much/enough N on the tested crop.
- Satellite Imagery, NDVI, can show areas of high and low biomass across fields.
2. Nutrient management in rotation
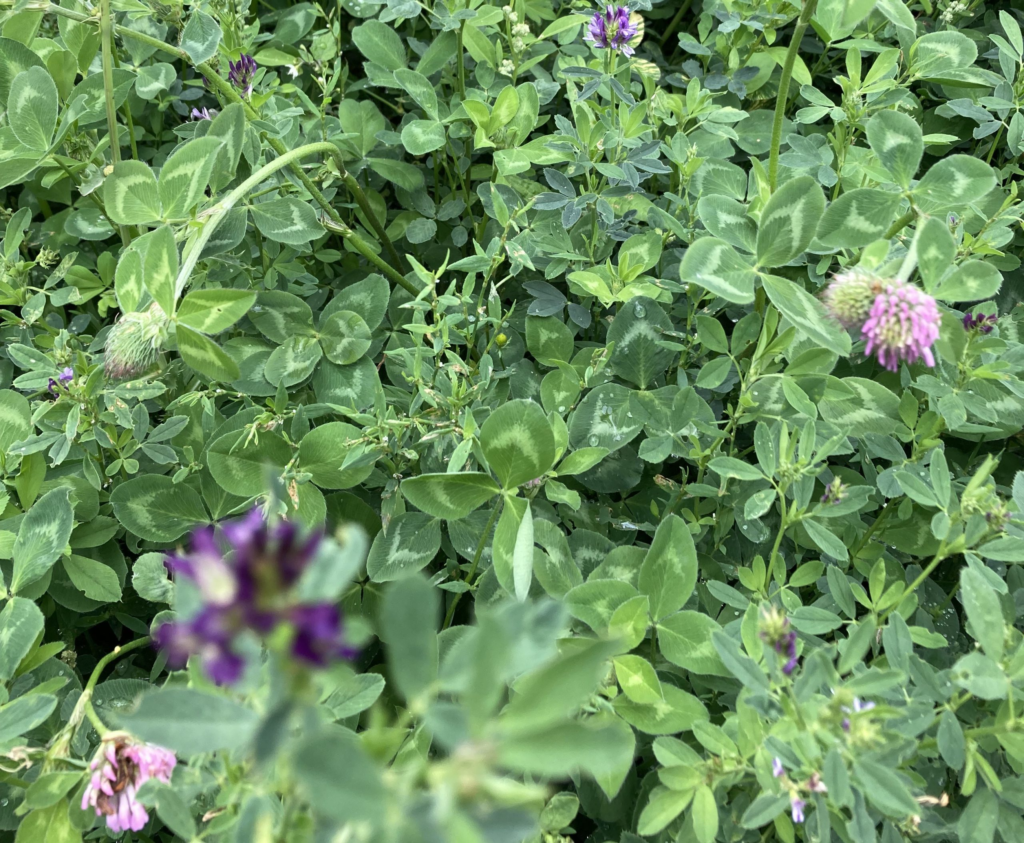
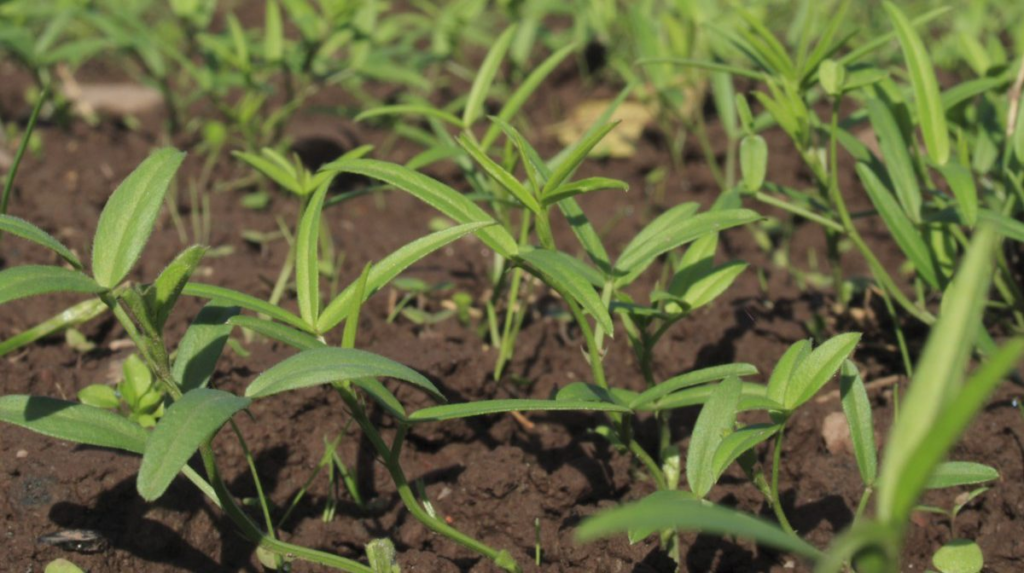
The use of cover crops or catch crops can scavenge residual soil nitrogen when sowed after harvest. Nitrogen will be utilised by the plants and stored within the crop until it breaks down and is reincorporated into the soil. These can be used to benefit the following crop by reducing the availability of nitrates to be leached and instead making them available as the residues are broken down. Crops can also be drilled into a standing cover or sown as an understory. This can be particularly beneficial with clover which fixes nitrogen further reducing the demand for artificial nitrogen.
Cover crops are a tool within the wider crop rotation which can be designed with greater diversity incorporating legumes and deeper rooting species to improve the soil structure and residual soil nutrients. By staggering crops with a high nitrogen requirement in a rotation the SNS can be maintained thereby reducing the artificial fertiliser requirements.
Introducing a legume crop into the rotation will facilitate the fixation of nitrogen into the soil which is available for a following crop and will also support improvements in soil health.
3. Fertiliser application
The method of application significantly influences the distribution and subsequent uptake efficiency of synthetic fertilisers. In the context of solid fertilisers, broadcasting is commonly employed, ensuring a uniform spread across the entire field. This approach is suitable for crops with dense canopies. Other methods for solid fertiliser application encompass placement, band placement, and pellet application. Employing more precise fertiliser application techniques enhances the ability to effectively target the root zone, optimising nutrient uptake but may come at added complexity and cost. When it comes to applications it is important to calibrate the spreader for each product used to ensure accuracy and reduce wastage.
An alternative to solid fertilisers which has experienced a resurgence in recent years, is foliar applications. This approach offers several distinct advantages over traditional solid fertilisers. Foremost among these benefits is enhanced efficiency, largely attributed to the rapid uptake time of products like dissolved urea, which can be absorbed in as little as 5 hours. This improved uptake time provides an additional advantage for alleviating deficiencies in a shorter time period with more flexible and tailored nutrient doses at the correct stage of growth. Additionally, by targeting the plant’s leaves rather than the soil, there is a reduced risk of soil acidification, along with diminished release of volatile compounds. This fosters a more favourable environment for soil biology to thrive and function effectively.
4. Improving the soil
Soil is a vital component of plant growth and has a huge capacity to improve nitrogen use efficiency through improving the physical and biological components in the soil. A healthy soil is one which promotes plant health and vigour with greater resistance to stress. Healthy soils are more resilient to extreme weather conditions, better able to retain more moisture during droughts and hold more water in periods of high rainfall, thereby reducing waterlogging. Not only does this reduce leaching but it also allows for better uptake of nutrients, including nitrogen, as the soil is coping with a wider range of weather without stressing the crops.

Improving soil conditions facilitates greater biological and fungal activity which improves nutrient cycling, and through interactions with the root zone an enhanced consumption and release of essential minerals.
Increased soil organic matter levels are an indicator of a well functioning soil. Indeed this helps to promote a better soil structure and water holding capacity but it is also a crucial energy source for the microorganisms responsible for nitrogen cycling. The integration of organic manures and composts, where feasible, can significantly augment soil functionality and performance.
To conclude
- To enhance nitrogen use efficiency, optimal soil conditions are critical.
- Ensure any fertilisers are delivered in the right amount, at the right time.
- Soil deficiencies should be minimised through sampling and proper nutrient management to allow for maximum uptake of nitrogen.
- Consider the use of foliar fertiliser applications to increase NUE at full crop canopy.


Recent Comments