
Improving the profitability and sustainability of UK dairy systems — enhancing biodiversity, reducing greenhouse gas emissions, and promoting high standards of animal health and welfare — has long been an ambition for the sector.
Understanding and quantifying the impact of a range of regenerative farming practice changes on those ambitions has, for the first time, been achieved with the work commissioned by WWF-UK. This was delivered with support from Cumulus Consultants and the Andersons Centre. (who developed the financial modelling of the three dairy system scenarios) and Farm Carbon Toolkit (who assessed the impact of practice changes across all three systems on greenhouse gas emissions, carbon removals, and biodiversity).
Cumulus Consultants and the Andersons Centre developed the dairy systems and the definition of what they would look like post-transition, and the Farm Carbon Toolkit used those models to quantify the climate and nature impacts.
Cumulus Consultants and the Andersons Centre led the work to characterise the three dairy systems analysed:
- High-yielding indoor dairy system
- Medium-yielding, winter housed system
- Lower-yielding, grass-based system
Practice changes modelled in the transitions included:
- Reducing nitrogen fertiliser use
- Lowering the livestock stocking rate
- Planting more diverse swards and herbal leys
- Rotational grazing
- Feeding less concentrate
- Reduced tillage
- Increasing tree and hedge cover
These changes led to reductions in milk yield and increases in milk produced from forage.
| Scenarios | ||||||
| Features | High-yielding indoor dairy | New system for high-yielding indoor dairy | Medium-yielding, winter housed | New system for housed and grazed | Lower-yielding, grass based | New system for lower-yielding, grass based |
| Land area (ha) | 194, o/w PP: 75.66 TP: 60.14 Crops: 48.5 Woods: 9.7 | 194, o/w PP: 75.66 TP: 50.44 Crops: 48.5 Woods: 19.4 | 167, o/w PP: 81 TP: 50 Crops: 27.65 Woods: 8.35 | 167, o/w PP: 81 TP: 53.3 Crops: 16 Woods: 16.7 | 88, o/w: PP: 49.28 TP: 25.52 Crops: 8.8 Woods: 4.4 | 88, o/w PP: 54 TP: 25.52 Crops: 0 Woods: 9 |
| Dairy cows | 308 | 230 | 247 | 190 | 141 | 114 |
| Dairy Youngstock | 172 | 82 | 138 | 68 | 62 | 41 |
| Milk yield (litres/ cow) | 9,663 | 6,790 | 8,169 | 6,790 | 5,959 | 4,967 |
| Forage area (ha) | 160.05 | 160.05 | 150.65 | 153.95 | 79.2 | 79.2 |
| Forage stocking rate (LU/Ha) | 2.46 | 1.69 | 2.1 | 1.46 | 2.17 | 1.69 |
| Replacement rate (%) | 27 | 17.5 | 28 | 18 | 22 | 18 |
| Concentrate use Kg/litre | 0.32 | 0.21 | 0.34 | 0.2 | 0.22 | 0.13 |
| Milk from forage (litres) | 3,197 | 3,892 | 2,374 | 3,893 | 3,261 | 3,617 |
Impact on greenhouse gas emissions
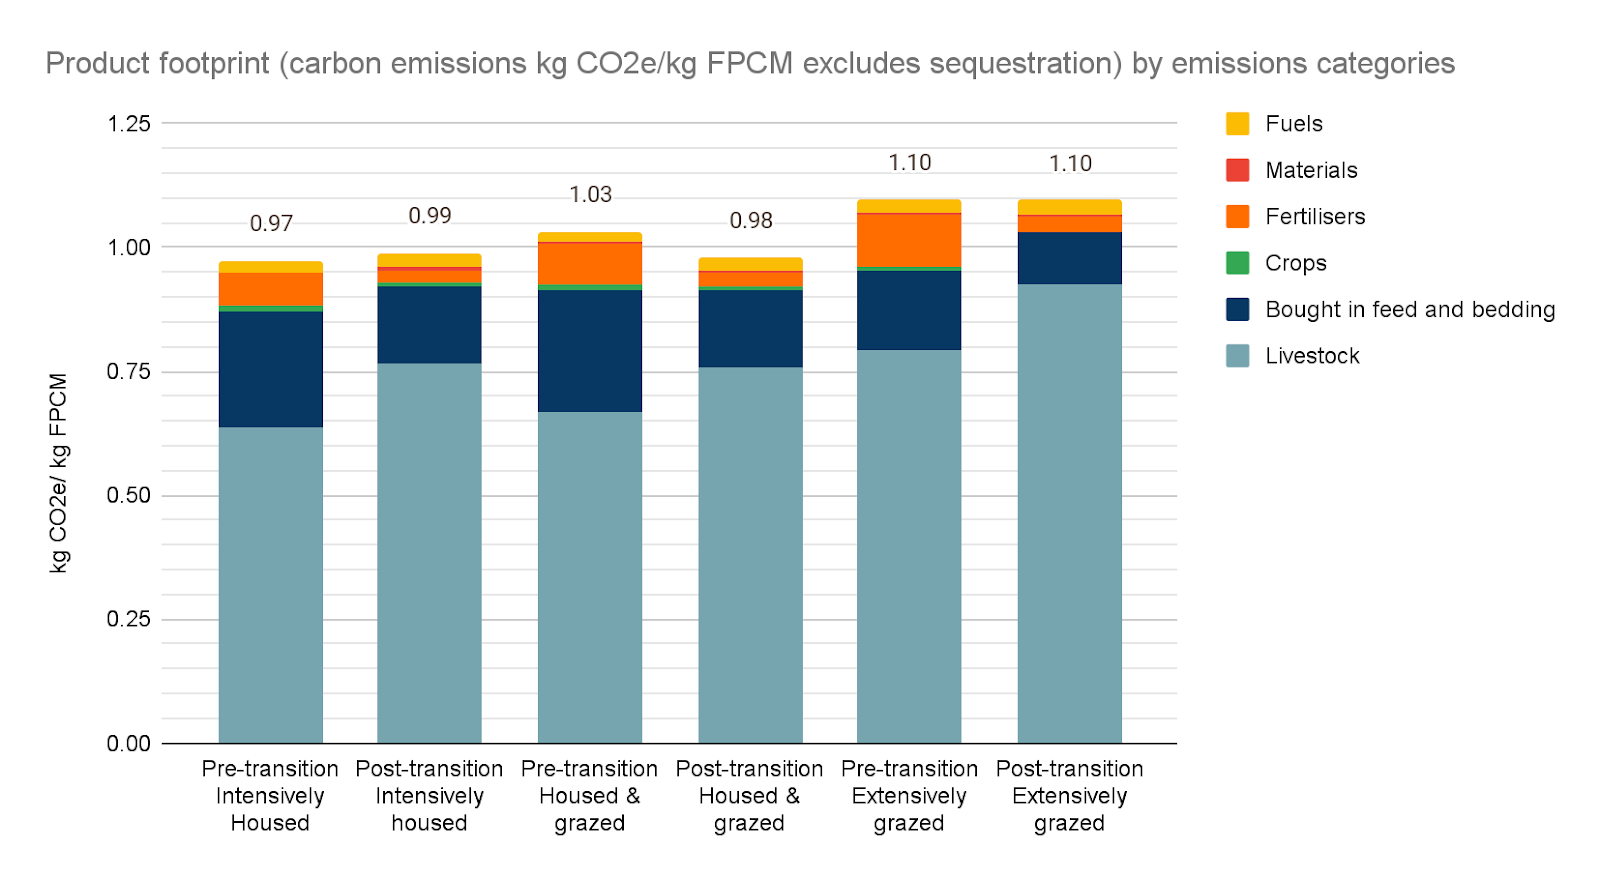
Farm Carbon Toolkit led this aspect of the work. The two charts below illustrate the impact of transitioning to the new system on greenhouse gas emissions (tonnes carbon dioxide equivalent) and the potential for carbon sequestration
Chart 1: Impact of the transition at the whole enterprise level
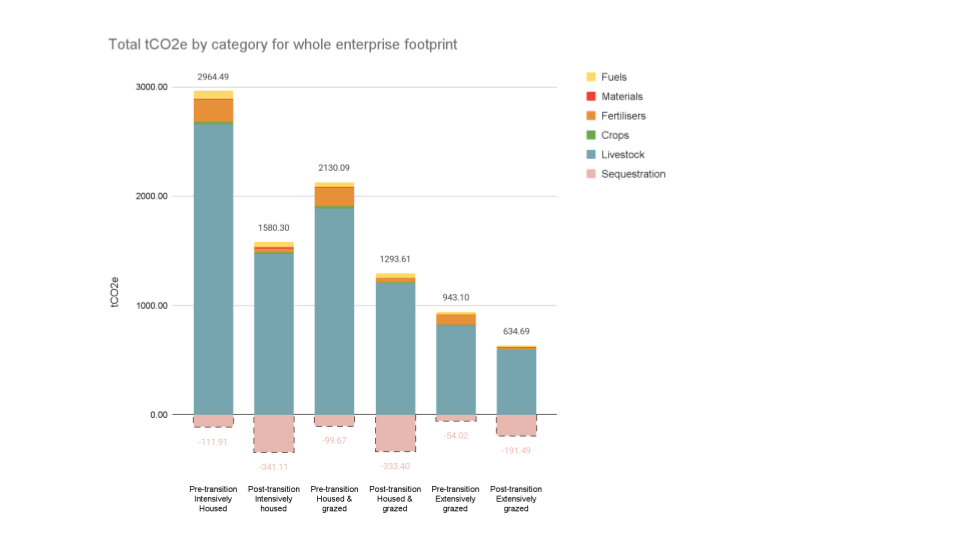
Chart 2: Impact of the transition at a per ha level
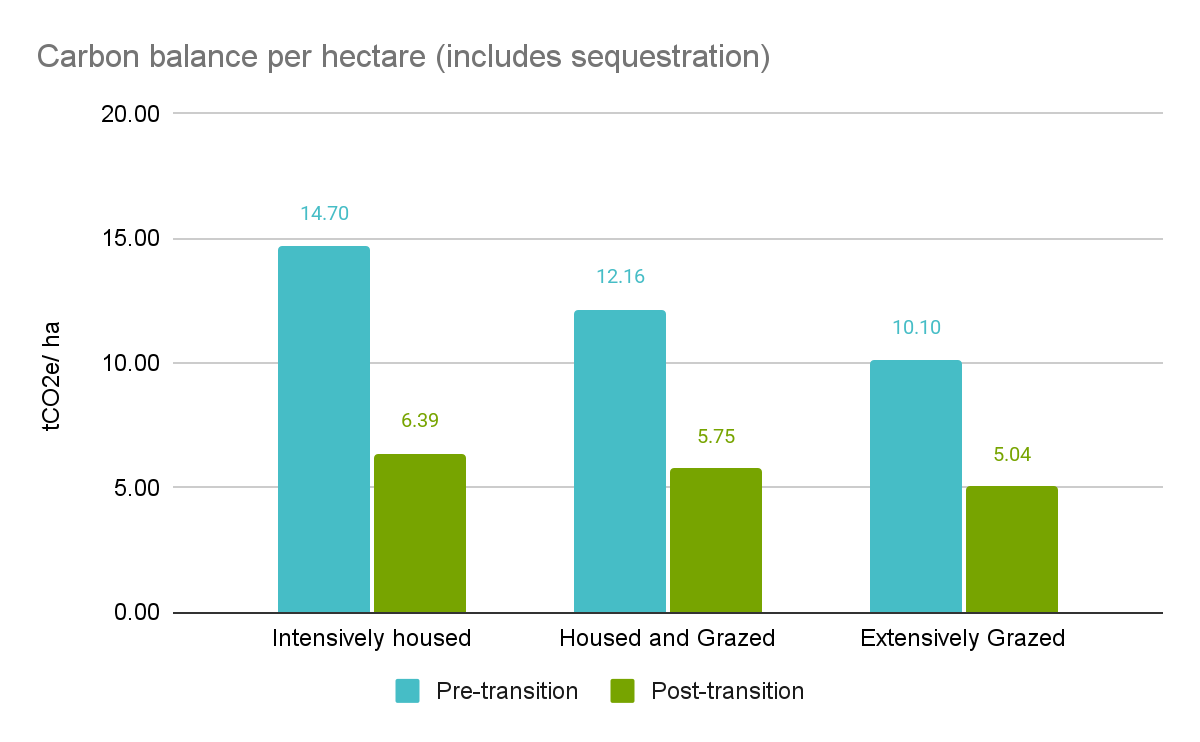
Chart 3: Impact of the transition at a per litre level
The key changes that have a significant material impact on emissions are reduced use of fertiliser and feed and lower livestock numbers.
This work clearly shows that emissions per litre of fat- and protein-corrected milk (FPCM) are broadly similar before and after transition, with the medium yield system showing the greatest reduction in emissions per litre (4.85%) after transition and the high-yielding system showing a 2% increase in emissions. Emissions from the forage-based system remain unchanged per litre. This is significant, as previous thinking suggested that increasing yield per cow would lower emissions per litre.
The critical factors within this modelling exercise are (not surprisingly) the assumptions used to build the models and their credibility at a practical level. The assumptions are laid out in the tables to allow readers to fully interrogate the work.
Nature impact of the transition
To complete this part of the work, FCT focussed on changes to biodiversity, water quality, air quality and soil health. The work was primarily based on a literature review and inclusion of carbon sequestration within the dairy systems, where the literature suggested this would occur.
The specific practices evaluated included:
- Rotational and holistic grazing (contributing to increases in soil organic matter of 0.1% over five years)
- Extending the grazing season
- Reducing nitrogen fertiliser use
- Lowering stocking rates
- Introducing diverse swards into the grass platform
- Reducing tillage depth
- Allowing greater hedgerow growth
- Increased area of woodland (4.6 – 9.7 ha more) with consequent carbon sequestration impacts
The review of a wide range of research projects highlighted consistent benefits for soil health, biodiversity increases, improvements in total annual grazing days possible, reduction in water pollution and leaching (P and N), and increases in soil organic carbon (SOC). Combining the practices leads to a greater impact than adopting them in isolation.
Financial impact of the transition
This work was completed by Cumulus Consultants and the Andersons Centre and is presented here in full, with minimal commentary from FCT. This was commissioned by WWF-UK for the purpose of their report Regenerative Dairy: Modelling the Transition Costs for Farmers in the UK.
A five to seven-year period was modelled for each system—from the starting system, through a five-year transition, to a final year post steady state—to assess the financial impact of the transition. This includes the effect on profitability and cashflow from the investment and divestment required for the transitions, as well as the likely ongoing financial outcome of the new systems.
In the charts below, the financial impact is shown for each of the transitions at a whole enterprise level with each system including a milk price increase of 1.5ppl.
Chart 4: Financial transition for the high yielding intensive dairy system
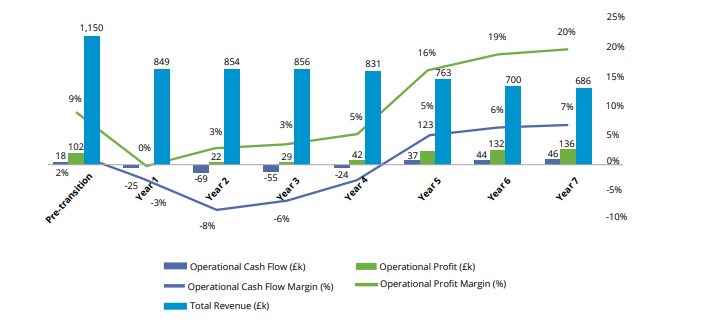
Chart 5: Financial transition for the medium yielding, winter housed dairy system
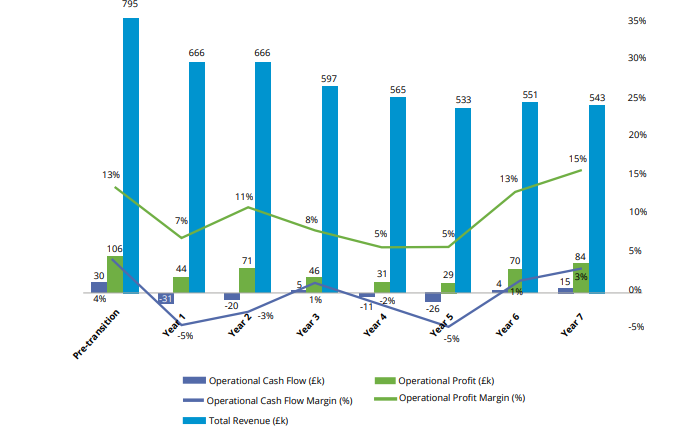
Chart 6: Financial transition for the forage-based dairy system
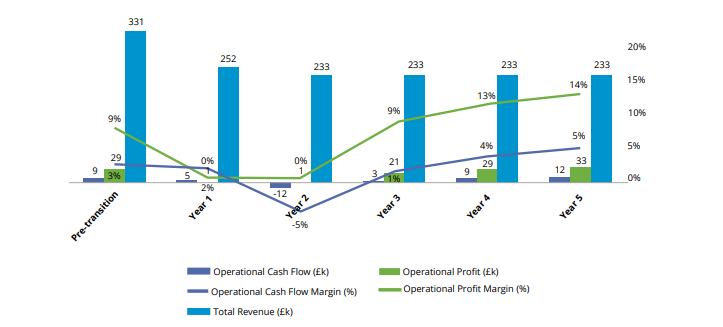
For all three systems, there is a period where profit and cash flow come under pressure due to the transition. This is linked to the investment required to facilitate the new system and the challenge of reducing livestock numbers. This is most noticeable for the high-yielding, intensive system. However, the challenge of undergoing the transition across all systems demonstrates the need for external support to bridge the cash flow gap over this period.
The financial benefits of the transition to a more regenerative dairy farming system include lower exposure to volatile input prices as reliance on such inputs is minimised. The cashflow position for all systems improved by year 7, apart from the medium yield, winter-housed system (down 1% in year 7 compared to year 1). By year 7, Profitability is predicted to be higher than in year one levels for all but the medium yield system, where lower profitability appears to be the new normal—even with the increased milk price of 1.5 ppl, which contributes from £8,500 – £23,500 to dairy profitability for the three systems modelled.
For all three systems, future profit is most sensitive to changes in milk price and feed price, although the level of sensitivity is much lower compared to year one, as exposure is much reduced through lower milk sales and reduced feed use.
Conclusion
This analysis demonstrates that the transition to regenerative dairy farming can result in a profitable business model—better able to withstand input and milk price shocks, while also cutting greenhouse gas emissions, improving biodiversity, and reducing pollution from farming activity.
The cashflow challenges during the transition period highlight the need for a collaborative, supply-chain approach to help de-risk the process—especially for the farmers, who will shoulder most of the risk.
The full suite of reports can be found here:
- The carbon and nature analysis of the transition to regenerative practices using three modelled dairy farm scenarios by Farm Carbon Toolkit. This document presents an overview of the methodology and results for the carbon emissions calculations and the findings from the literature review on nature impacts of key regenerative dairy practices.
- Economic modelling shows all types of dairy farms are more profitable and resilient at the end of the transition to regenerative practices. However, the transition period (‘fallow years’) is long, and support is needed from the public and private sector.Documentary films feature the personal stories of the five UK dairy farmers on the case study report, challenges and benefits.Practical guide for farming consultants and finance practitioners shows the financial implications, the government and market support available across England, Scotland and Wales, and the carbon and nature impacts of regenerative dairy farming practices.
- Case studies: This report showcases five farmers’ transitions to nature-friendly dairy farming, driven by improved system that places nature at the centre, work-life balance and future environmental and economic resilience of the farm. It highlights that regenerative farming is both financially sensible and a strategic business decision.
- Insights from sector engagement in England and Wales explores the financial and business case for regenerative dairy with farmers, banks, food retailers, food producers, farm advisors, NGOs, and civil servants. Outlines key actions for government, financial institutions and the dairy sector.


Recent Comments