

There is a growing interest in biomass crop cultivation in the UK to provide materials for biobased products and to offer environmental protection benefits. Biobased materials offer an alternative to single use plastics, construction materials derived from fossil fuels and can replace peat with home grown wood fibre from fast growing perennial crops. In collaboration with AFBI, Crops for Energy, Calvium, and supported by funding from the Centre for High Carbon Capture Cropping (CHCx3), we investigated the greenhouse gas (GHG) emissions associated with growing various biomass crops in the UK compared with arable and livestock farming.
The emissions calculations will be provided on the Envirocrops platform, whose development has been funded by DESNZ, to aid farmers in decision-making when considering switching part of their land into biomass crop cultivation.
What we did
We provided two arable and six livestock farming scenarios to compare with the cultivation of six different biomass crops and modelled the associated emissions using the farm carbon calculator (see Table 1). As some of the biomass crops have a long lifespan (10 – 25 years) with the potential for multiple harvests from one planting, the emissions for each farming scenario were modelled over a 20 year period.
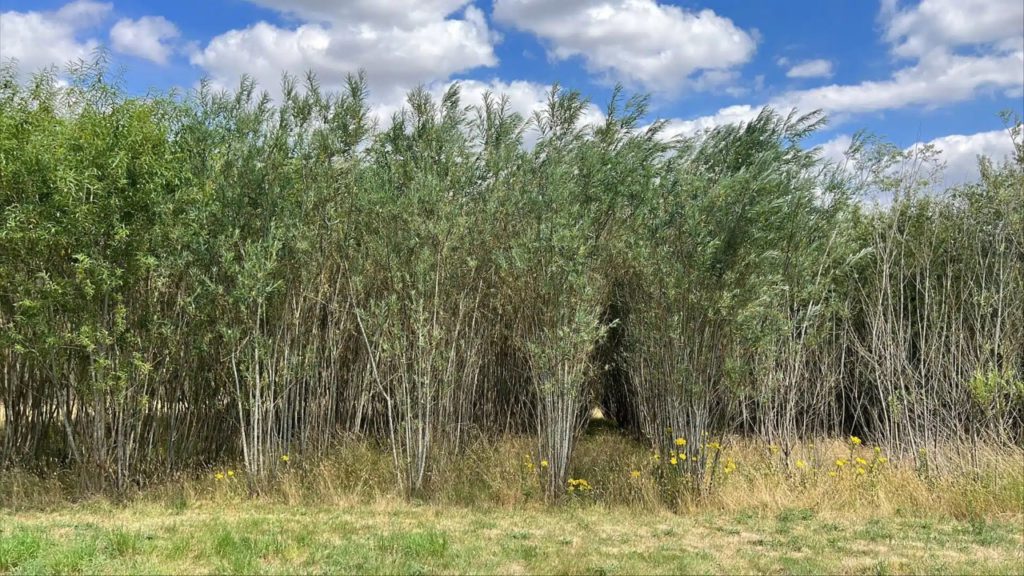
The biomass crops included in the project were short rotation coppice (SRC) willow, SRC poplar, miscanthus, switchgrass, reed canary grass and hemp. As hemp is an annual crop, it was swapped in for a crop in the arable 3 or 5-year baseline rotations. For the other biomass crops, two scenarios were modelled, either conversion from arable land or conversion from grassland, which differed in their field preparation operations and herbicide application, to provide the comparison to the arable or livestock grazing scenarios respectively.
Only associated emissions from the different farming practices were modelled but no potential carbon sequestration due to the high level of uncertainty and lack of current available research (particularly with biomass crops grown in the UK). Additionally, any emissions or sequestration from carbon stock changes in soils were not modelled, as this would vary largely depending on a variety of factors (e.g. location, soil type, season). Emissions were modelled to farm gate and do not include the downstream processing of crops. To see a more detailed outline of the data that went into the GHG calculations, visit our assumptions document here.
Table 1. The farming scenarios and their modelled emissions.
| Scenario | Emissions taken into account |
|---|---|
| Arable | |
| 3-year baseline rotation |
Rotation: Winter Wheat, Spring Barley, OSR
|
| 5-year baseline rotation |
Rotation: Winter Wheat, Spring Barley, OSR, Field Beans, Winter Wheat
|
| Livestock | |
| No input grazing cattle |
|
| Low-input grazing cattle |
|
| High-input grazing cattle |
|
| High-input silage cattle |
|
| No input grazing sheep |
|
| Low-input grazing sheep |
|
| Biomass crops | |
| Hemp (conversion from Arable land) |
Swapped in for OSR in 3 and 5-year arable rotations
|
| Miscanthus Switchgrass Reed Canary Grass SRC Willow SRC Poplar (conversion from arable and grassland) |
|
What we found
As biomass crops can be planted once, harvested repeatedly and require little to no fertiliser inputs over the 20-year period, the emissions associated with cultivating biomass crops are considerably lower than the arable and livestock farming scenarios.
Arable comparisons
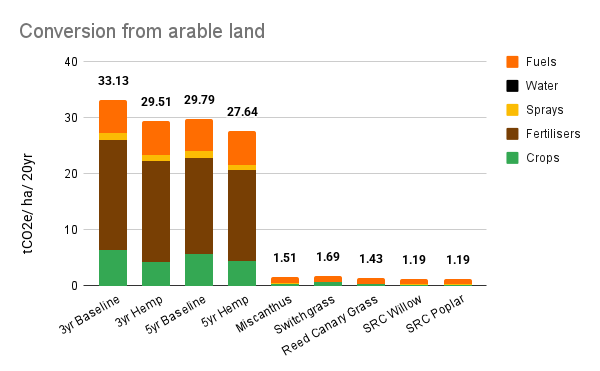
The biggest contributor to the arable scenario emissions is from fertilisers (see Figure 1). Swapping hemp into the rotations decreases emissions by an average of 9.2% when compared to the average of the 3 and 5-year baseline rotations.
For the perennial biomass crops, there is an average 95.5% decrease in tonnes of CO2e per hectare per 20-year period compared to the average of the arable baselines. This is largely because the perennial biomass crops do not require fertilisers, the application of sprays and fertilisers is often not possible once the crops are established due to their size. However, It is worth noting that soil testing and site choice are essential to help establish any nutrient requirements prior to biomass planting, which has not been included here due to its varying nature.
Additionally, because the rootstock of the perennial biomass crops remains viable for many years (excluding hemp), emissions associated with biomass crop residues are lower.
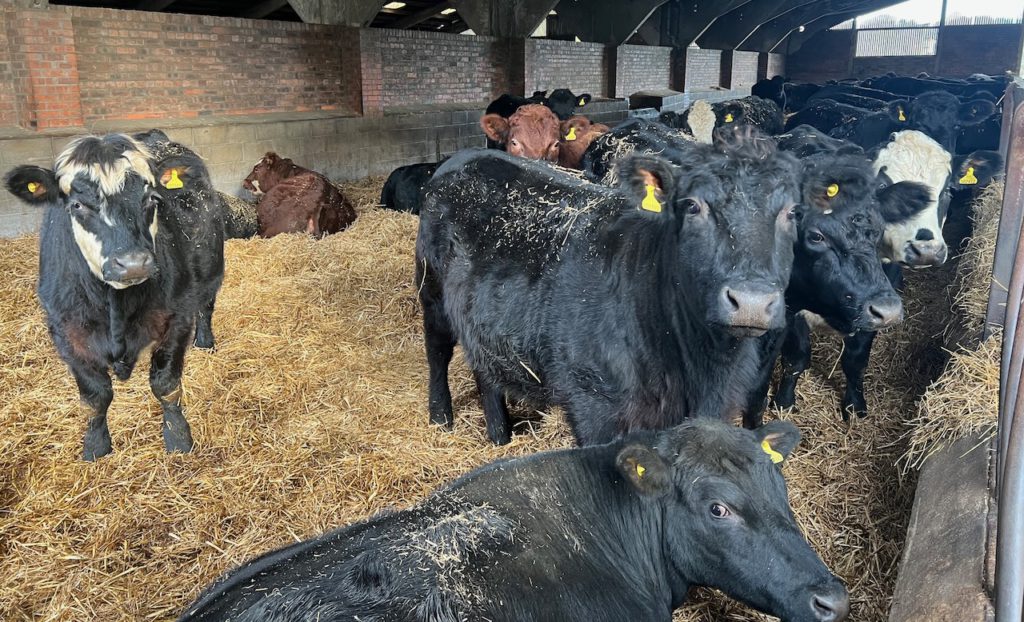
Livestock comparisons
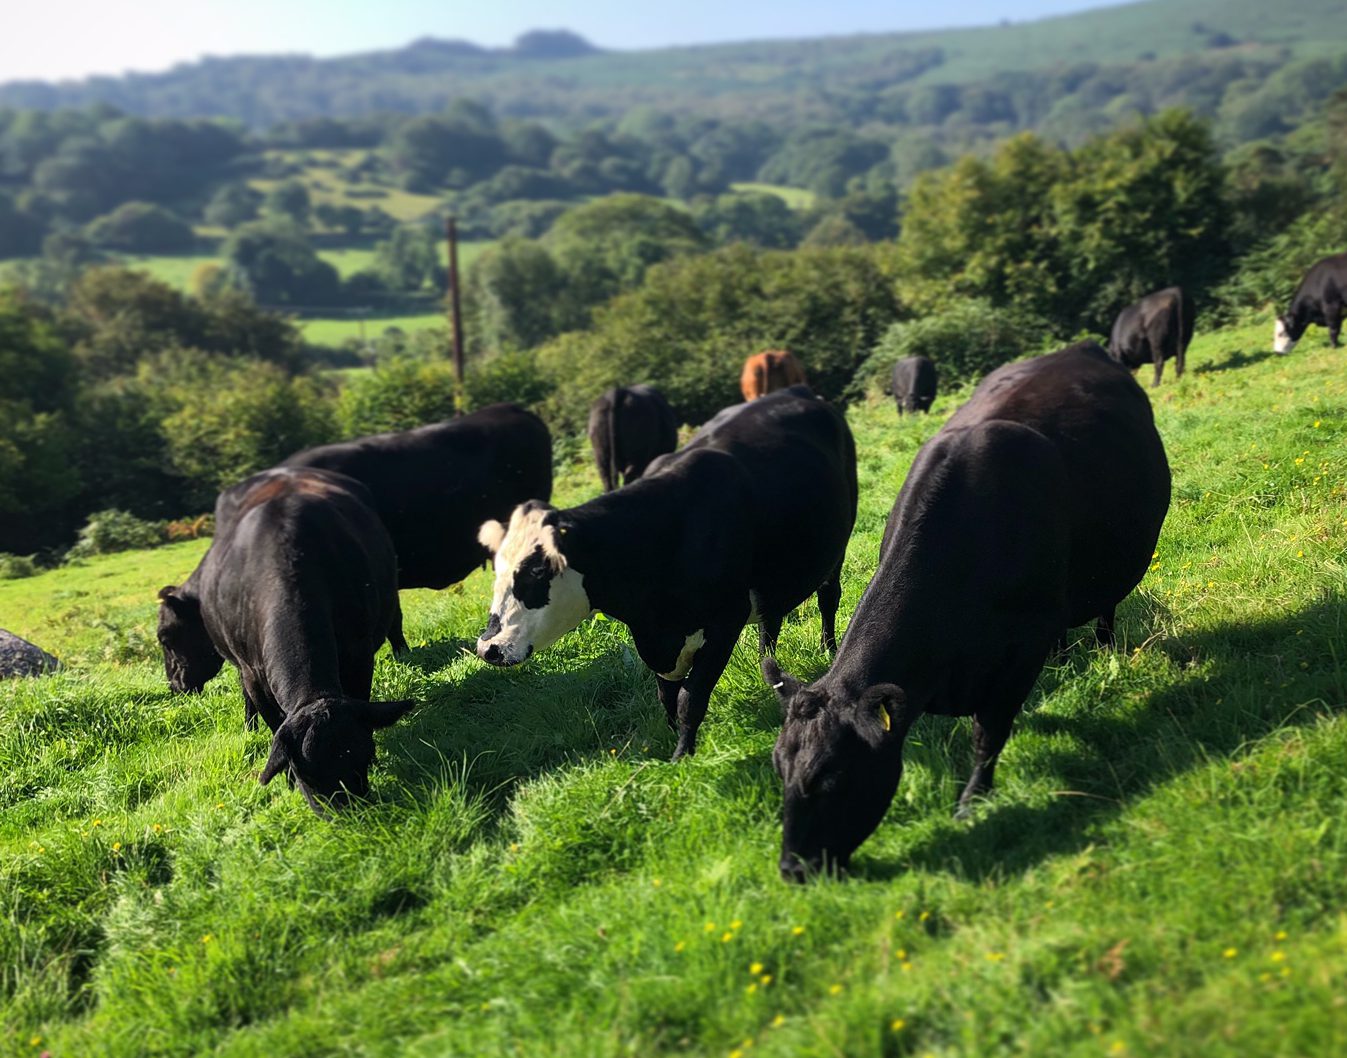
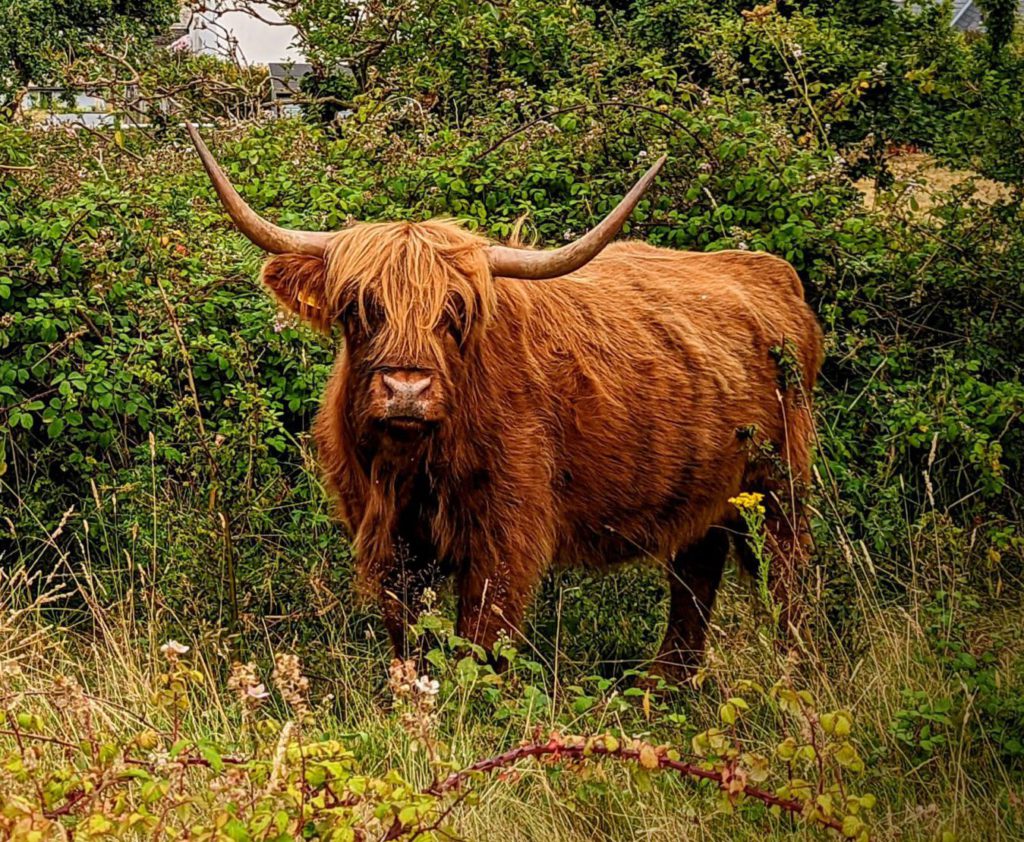
Livestock comprise the largest proportion of emissions in the grassland grazing scenarios (see Figure 2), which is associated with enteric methane production and manure emissions. There is a potential average 97.6% reduction in emissions when switching to biomass crop production (per hectare, per 20-year period).

Summary
From these example farming scenarios we can see that the emissions associated with cultivating biomass crops are substantially lower than arable and livestock farming. An increase in biomass cropping in the UK and Ireland has the potential to aid in the transition towards net zero goals, along with diversifying farming portfolios and income streams. Biomass crops can often grow on marginal land that may otherwise be unproductive. They can also be incorporated into food production systems, for example, SRC and short rotation forestry (SRF) tree crops can be planted as agroforestry silvopasture or silvoarable systems, to offer increased biodiversity in farming systems. As part of this project we were able to research and include additional biomass crop emissions factors in the Farm Carbon Calculator, contributing to our project aims on the CHCx3 project.


Recent Comments