To accurately estimate the emissions and sequestration from your beef enterprise, you will need to add data to the following sections of the Calculator:
When setting up the report, make sure you enter the area of grazing (grassland) as well as any non-agricultural land area and cultivated land (arable or horticultural)
Use the Livestock section and select beef cattle. Add as many entries as you need to cover your herd. For example, you may have two groups of steers with different liveweights or kept on the farm for different lengths of time. In which case, enter the steers from the first group with one liveweight and then the steers from the second group as a separate entry with their own liveweight. This will give you more accurate emissions from their enteric fermentation (gut methane).
To calculate the average head of livestock on the farm over a 12 month period, take the number in a particular livestock category per month (so you have 12 “snapshots”) add these together and then divide by 12. Our data collection sheet has a help sheet for this. For growing animals, you may want to use the same approach for calculating average liveweight (our defaults assume a midpoint liveweight through the year for growing cattle but growth rates won’t be linear so using the snapshot approach may be more accurate)
Livestock entries also capture the CO2 equivalent (CO2e) of the methane emissions from enteric fermentation and of the nitrous oxide (N2O) emissions from the animals’ manure over the course of the year. The Calculator asks you how this manure is managed as this has an impact on the N2O emissions
You have the option to input the average dry matter intake (DMI)per animal per day (kgDM/head/day). The DMI can be used to more accurately calculate the enteric emissions of the cattle, and if left blank, a simpler algorithm will be used that does not consider DMI
You will need to account for any supplemental feeding via the Livestock > Animal feeds option – this is for brought-in feeds that were produced off-farm
Account for all your fuel use, electricity use, consumables, inventory items and waste produced using the relevant sections (Fuels, Materials, Inventory, Waste). However, if you also have a dairy herd or arable operation, you may prefer to create a separate report and use this as an Overheads report to apportion shared capital items and energy usage emissions between your enterprises. Watch our video to see how this works in practice.
We recommend getting your soil sampled and have a guide on how to do this effectively and affordably. By monitoring your soil organic matter or soil organic carbon over time you can begin to log sequestration rates in your grazed (or other) soils. Once you have two years’ worth of soil sample results, you can enter these in the Calculator under Sequestration > Soil Organic Matter (you will also need bulk density measurements and a record of the depth of the sample).
If you don’t have directly sampled soil data for all your soils, you can use our range of proxy values for different Countryside Stewardship and habitat classes to estimate how much carbon your soils may be sequestering year-on-year. You can also measure the length of any hedgerows and field margins (ungrazed) and enter these to estimate the carbon sequestered in them on a yearly basis.
Emissions from livestock cover two broad categories:
Enteric methane emissions (this is the methane produced by the animals digestion)
Greenhouse gas emissions from the manure and slurry produced by the animals.
When you enter a group of animals in the Farm Carbon Calculator e.g. 100 dairy cows, the Calculator will consider both enteric methane emissions and the nitrous oxide, ammonia and methane emissions associated with the manure or slurry those 100 dairy cows produce over the course of 1 year.
It is really important to enter the average number of animals in a category over the course of the year rather than the total number. For example, if you have 100 dairy calves on farm for only 6 months of the year, you should enter 50 dairy calves. Otherwise the Calculator will have to assume that all 100 calves are on farm for all 365 days of the year, which would overestimate the enteric methane production and the amount of manure produced.
Why do the emissions associated with livestock vary?
In the Farm Carbon Calculator, we ask users to tell us the number of livestock in a range of different livestock categories. The emissions produced by animals will vary based on:
Number of livestock (more animals means more emissions)
Liveweight of animals (larger animals tend to produce more manure)
Type of livestock (ruminants produce enteric methane, monogastrics don’t. Each type of animal has its own “rate of excretion” and different animals’ manures produce methane at different rates)
Pregnancy and lactation (pregnant or lactating cattle produce more enteric methane for their size)
Manure or slurry storage (rates of methane and nitrous oxide, emitted indirectly through leaching and ammonia volatilisation, vary depending on how the manure is stored and for how long)
Where manure/ slurry is spread (if manure is spread, the type of land it is spread on will affect the rate of indirect nitrous oxide emissions through leaching).
What about slurry covers, storage bags, slurry bugs etc… ?
We are actively working on incorporating a lot more options into the Farm Carbon Calculator to allow users to give more detail on their manure management practices. We plan to include options in 2024 for sending manure and slurry to anaerobic digestion, adding detail on slurry pit coverage, storage timing, and different application or incorporation methods for slurry (e.g. trailing shoe versus splash plate).
We are also researching the possibility of including slurry bugs (bacteria that inhibit greenhouse gas production from slurry stores) and chemical nitrous oxide inhibitors (that reduce the emission of greenhouse gases when the slurry is applied to the soil) as options so that users can show the benefits of these in reducing their slurry emissions. Similarly, we would like to be able to include methane inhibitors that can help to reduce enteric methane emissions for livestock.. To date though, the quality of independent scientific evidence for these management practices is very variable and different products show variable results depending on the farm environment, so it is harder for us to give robust estimates of the effect they will have on a farm’s emissions.
One of the wonderful things about working for FCT is that no two days are the same. I am incredibly lucky that I get to work with such a brilliant group of colleagues and some fantastic farmers. Everyone brings new skills, knowledge and interests, which allow us to learn from each other and share ideas which is really rewarding.
This week has been an interesting week. I am currently delivering a new course which is being run by the University of Cumbria entitled Upland Farming for Net Zero. We have a great cohort of 15 students who are either directly farming or involved in supporting our upland farmers in the South West. This week, we have had online sessions focussing on storing more carbon in upland environments and measuring emissions from livestock, alongside a farm visit on Monday to discuss what it all means in practice. What’s great about this course is that it also feeds into a project we are just completing, which has built a version of the carbon calculator specifically for upland farmers to be able to take account of carbon on-commons, which is a welcome step forward.
I have also run a couple of training sessions for groups within the Royal Countryside Fund, providing an introduction to managing carbon on the farm. Although I do a lot of these types of talks, they never get boring as each session yields a different set of questions. What I get most enjoyment from is the interaction with the farmers and helping them to see how what I’m saying could be put into practice. It’s so rewarding to be able to help in some small way, even if it is just to help empower them to feel part of delivering the solutions.
Alongside talks, I have been finishing off a couple of reports for projects that are coming to an end: a dairy footprinting project combining farm footprints for the supplier farms with the operational footprint of the processing site, and writing some factsheets for farmers around the importance of managing manures and the opportunities with cultivation. There is always more to do and new projects and ideas to explore.
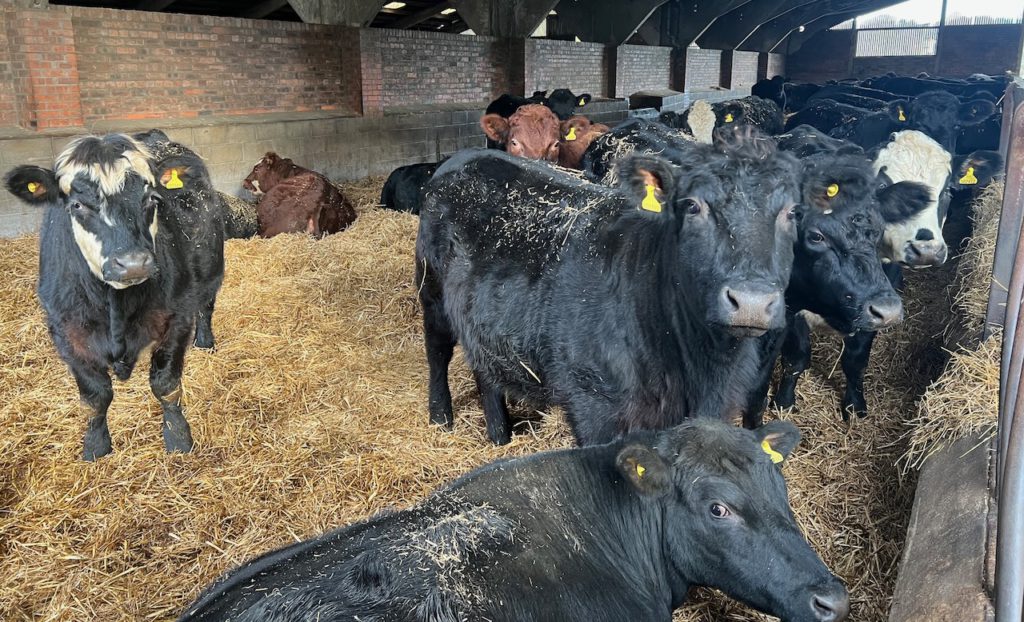
A Farm Net Zero (FNZ) event held in March 2023, Trenance.
Methane emissions from livestock make up a large part of a farm’s carbon footprint, capturing and processing these emissions can help to reduce the carbon footprint. Farm Net Zero Monitor Farmers, Katie and Kevin Hoare, milk 120 cows on a 130-acre Cornwall Council holding which required investment to improve slurry storage. They have worked with Cornish company Bennamann as part of a pilot with Cornwall Council to install a covered slurry lagoon that captures and processes methane gas for use as a fuel. A group of farmers met to learn more about the system, with talks from Dr. Chris Mann, co-founder of Bennamann, and George Mills, Area Sales Manager at New Holland who supply methane-powered tractors. This event was made possible with thanks to the National Lottery Community Fund who fund the Farm Net Zero project.
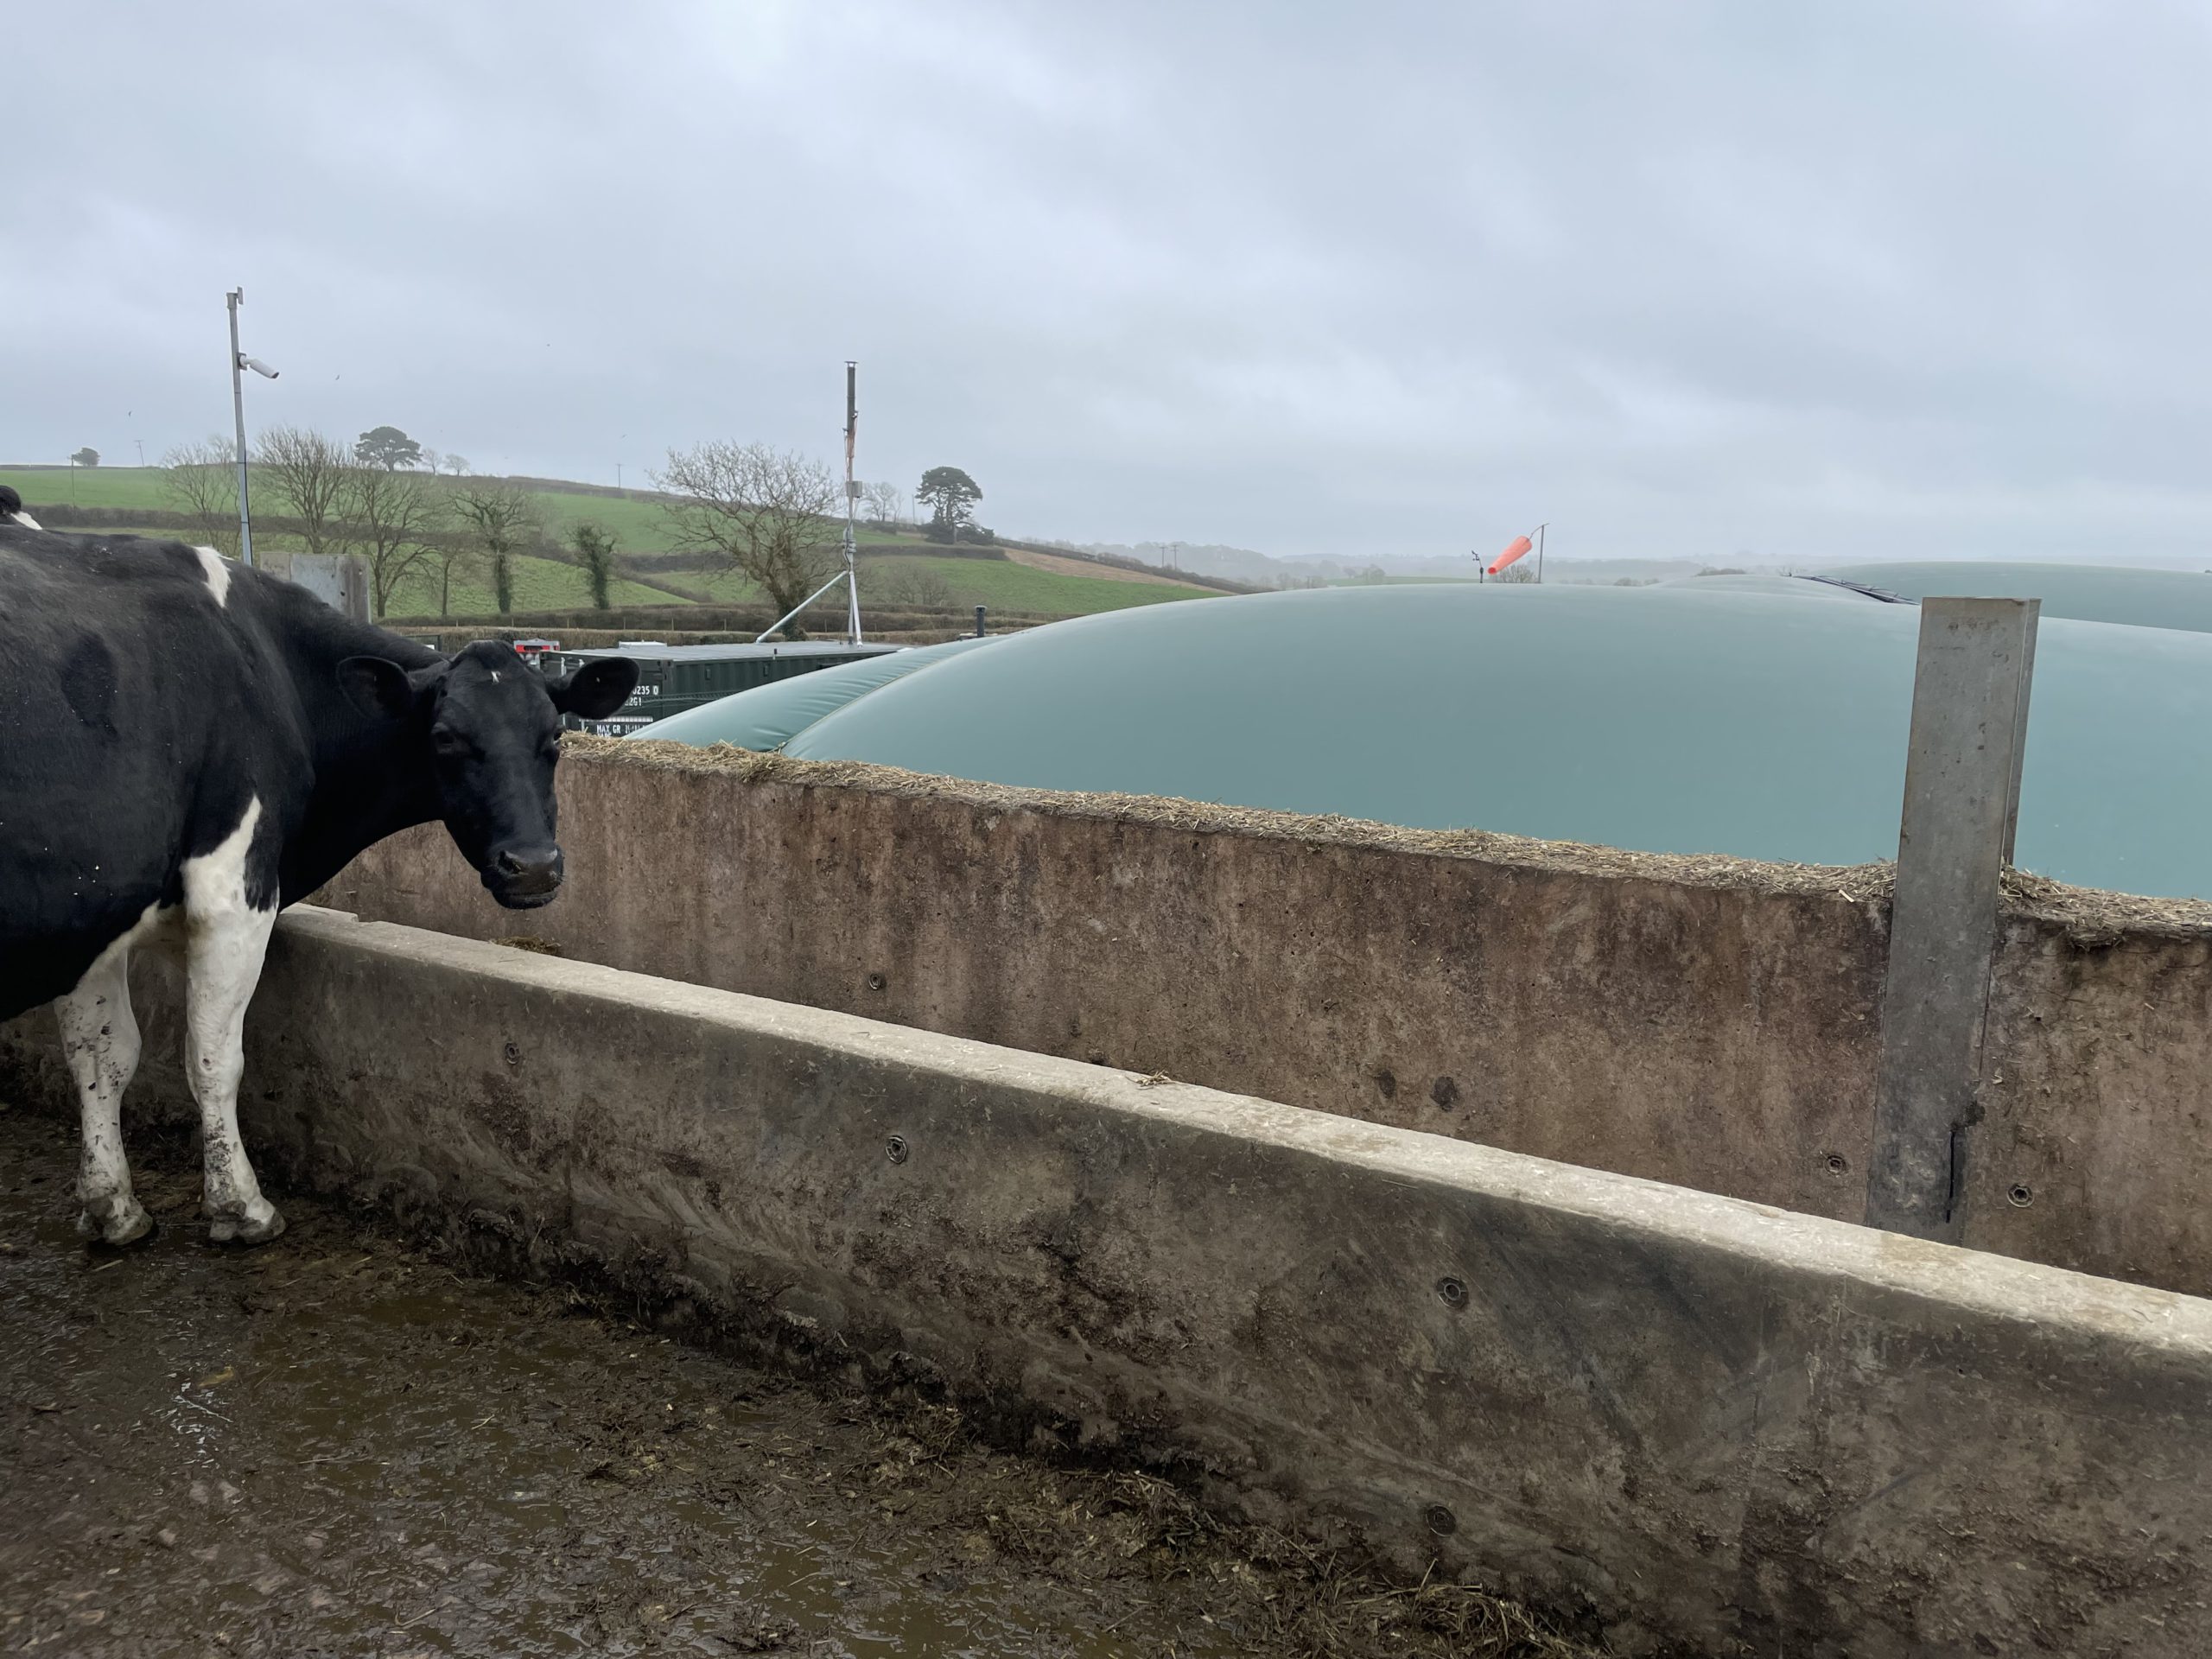
Chris Mann explained how the Bennamann system works, and how it can allow slurry pits to become mini power stations. Slurry is scraped into a reception pit where it is macerated to enhance breakdown and then into a well-insulated lagoon where microbial activity produces methane and other gases, as it does in an uncovered pit. The gases are collected by the cover, processed in a shipping container-sized plant unit with the cleaned methane pumped into another reception chamber sitting above the slurry pit. This processed methane can then be bottled and used as fuel in New Holland’s methane-powered tractor, or in a Bennamann methane-powered generator to provide electricity either for on-farm use or sold to the grid.
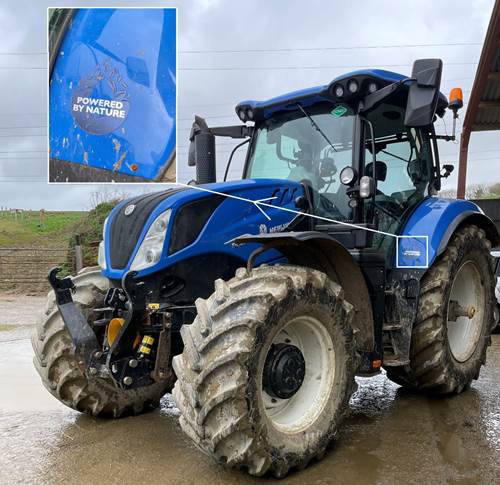
George Mills showed the group around New Holland’s methane-powered tractor. Currently, this is able to do four hours of work on a single tank, with a range-extending fuel tank/front weight increasing this to twelve hours. Although slightly more expensive than a diesel tractor, the ability to run on home-produced gas can mean it is cheaper to run in the long-term by avoiding fluctuating fuel prices. Plus, the reduction in diesel use can have major benefits to reducing the farm’s carbon footprint.
Kevin and Katie say the covered and processed slurry is a better product to use as it is almost like digestate, allowing them to apply it with a trailing shoe between grazings and reduce the amount of artificial fertiliser they require. They are now able to meet all the grassland’s P and K needs from slurry, which has clear financial benefits and also helps their carbon footprint by reducing demand for carbon-intensive artificial fertiliser. A grass yield trial is in development to quantify the benefits of the new slurry.
The ultimate aim for Trenance is to go off-grid, with the methane capture system providing all the fuel for machinery and electricity. Katie and Kevin are keen advocates for agriculture’s role in providing climate change solutions and feel it is important for farmers to tell their story to the public to demonstrate their commitment to the environment. Using the Farm Carbon Calculator for Trenance through the Farm Net Zero project shows that the new slurry store is capturing around 600 tonnes of CO₂e from methane, putting the overall carbon footprint at 0.13 kg of CO₂e per kg Fat- and Protein-Corrected Milk (FPCM).
Key takeaways:
Methane capture from slurry reduces the farm’s carbon footprint by preventing methane entering the atmosphere
Using processed methane as fuel also reduces emissions from red diesel and electricity use
The methane capture system has financial benefits through reductions in fuel/electricity purchases, the option to sell gas and the ability to use slurry more effectively and replace bought-in fertiliser.
Farm Net Zero resources, events, newsletter
To find out more about other previous events, trials and resources produced from the Farm Net Zero project head here.
To keep an eye out for future Farm Net Zero events head to our events webpage here.
To keep up to date with the project subscribe to the Farm Net Zero newsletter here.
We use cookies to ensure that we give you the best experience on our website. This includes analytics cookies to understand website traffic and how users interact with our website. We do not use any advertising cookies.
You may accept or refuse our use of cookies, or learn more at the link provided.
Strictly Necessary Cookies
Strictly Necessary Cookie should be enabled at all times so that we can save your preferences for cookie settings.
If you disable this cookie, we will not be able to save your preferences. This means that every time you visit this website you will need to enable or disable cookies again.


Recent Comments