Category: Calculator

Harmonisation of Carbon Accounting Tools for Agriculture – Webinar Replay

Watch a replay of this webinar held on the 11th September 2024 where representatives of the three major farm carbon calculators shared more details of the work they are doing together: Work to support UK agriculture to measure GHG emissions using the most up-to-date and accurate tools possible, harmonising the methodologies and outputs of their carbon calculation tools.

The three major farm carbon calculators featured in the Defra Report Harmonisation of Carbon Accounting Tools for Agriculture – SCF0129 who were Farm Carbon Toolkit, Cool Farm Alliance Community Interest Company and Agrecalc Limited – announced a collaboration earlier in 2024 by signing a Memorandum of Understanding (MOU), intended to harmonise the methodologies used in calculating the greenhouse gas (GHG) emissions from agriculture.

….. more webinar information to follow soon …..

Webinar Q&A

We received a great list of questions during the webinar event and teams from the various calculators will look to address those queries in due course.

Media contact: Kandia Appadoo ([email protected])


The Farm Carbon Calculator Update – October 2024

Farm Carbon Toolkit Team at annual field day - announcing update to Farm Carbon calcualtor

The calculator just got a little bit bigger and better

This October all calculator users will benefit from an incremental update to The Farm Carbon Calculator. We’re always looking and listening for ways to improve the tool – and in accordance with our annual development cycle we’ve added some as quickly as we can in this update.

The changes described below change our transparent methodology, and are listed in detail in an update note – read it

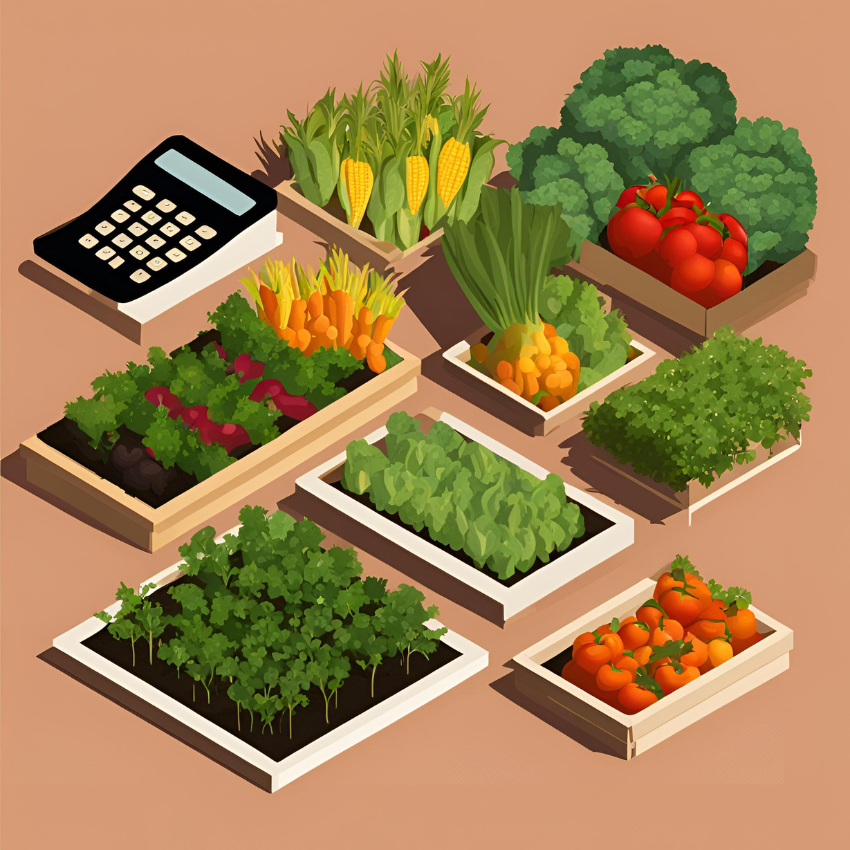
Image showing crops next to a simple calculator

Š copyright Farm Carbon Toolkit – AI Generated

What’s new?

Calculated emissions adapt to reflect your crop management decisions

We know there are a wide range of practices around how crops are harvested or managed. Whereas before we relied on averages to calculate emissions here, now you can account for the specific way you manage each crop. The more detail you can enter, the more accurate your footprint will be.

The update applies to all crops – here’s some examples and the new ways the calculator estimates related emissions from these:

For agricultural crops like barley you can now choose from options relating to the amount of crop residue – you will see the following options:

  • Most of the barley straw left in the field
  • Half of the barley straw removed, half left in field (default)
  • Wholecrop or most of the barley straw removed from the field.

For your horticultural crops like potatoes you can also indicate what happened to residues:

  • Most of the crop residues left in field (default)
  • Most of the residues removed after harvest.

For green manures, temporary grasslands and cut forages select from the following:

  • Green manure with all residues left in field after mowing (default)
  • Forage crop with half of the residues foraged in place
  • Cash crop with all residues removed from the field.

Where you don’t have the detail to enter we revert back to a sensible default which suits the crop in question. So don’t worry – we’ve done this so the Calculator remains easy to use and crops can be entered just as before where needed.

Emissions now calculated from fruit crops

Until now the Calculator has accounted for fruit crops so yields can be recorded. Our research has reached a level of detail where we can confidently indicate emissions associated with this fruit yield – whereas before we could only account for sequestration from perennial fruit crops. 

Emissions are now calculated from the growing the fruits alongside detail on their management and their renewal rate where applicable. It is this level of detail that has allowed us to take this step – which we think greatly improves the calculator for fruit farms.

Log in to see emissions for: Blackberries, Blackcurrants, Blueberries, Cranberries, Gooseberries, Raspberries, Redcurrants, Strawberries, Apples, Cherries, Grapes, Hops, Kiwiberries, Nuts, Pears, and Plums.

Better record of the operations and activities on your farm

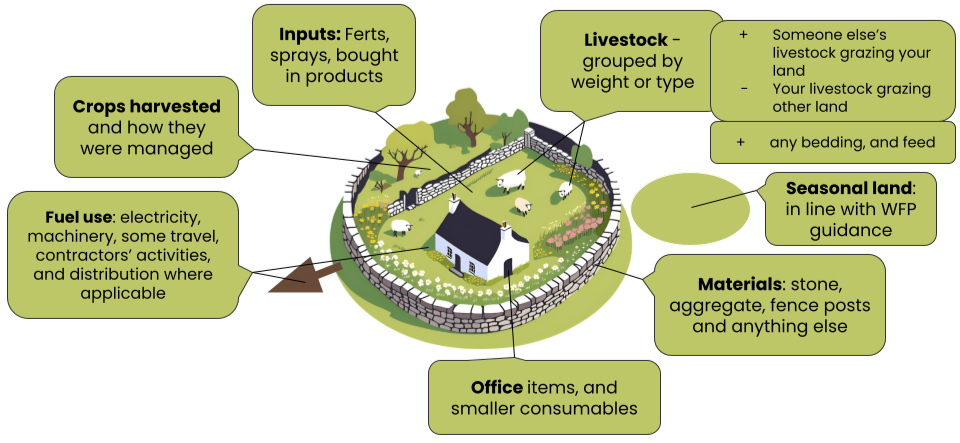
Accounting for fuel use and farming operations just got even easier. We’ve increased the amount of modelled emissions for different farm operations by working closely with industry professionals. 

If you don’t have all your fuel use figures but you know what farming operations you completed or contracted out, we’re confident you will be able to record this. Choose from 47 different activities like drilling, harvesting, soil preparation, bailing and much more. You’ll know the number of different types of operations needed on your farm – it’s likely that if you do it, we can help estimate emissions from it.

Here’s an example of the options now available under the general category of baling:

  • Running a bale wrapper
  • Baling by the bale – Small rectangular bales
  • Baling by the bale – Round bales
  • Baling by the bale – Heston bales
  • Baling by area ~250 Small rectangular bales per ha
  • Baling by area ~15 Round bales per ha
  • Baling by area ~7.5 Heston bales per ha
  • Baling by area (general).

More detail to capture your unique farm’s purchases and waste

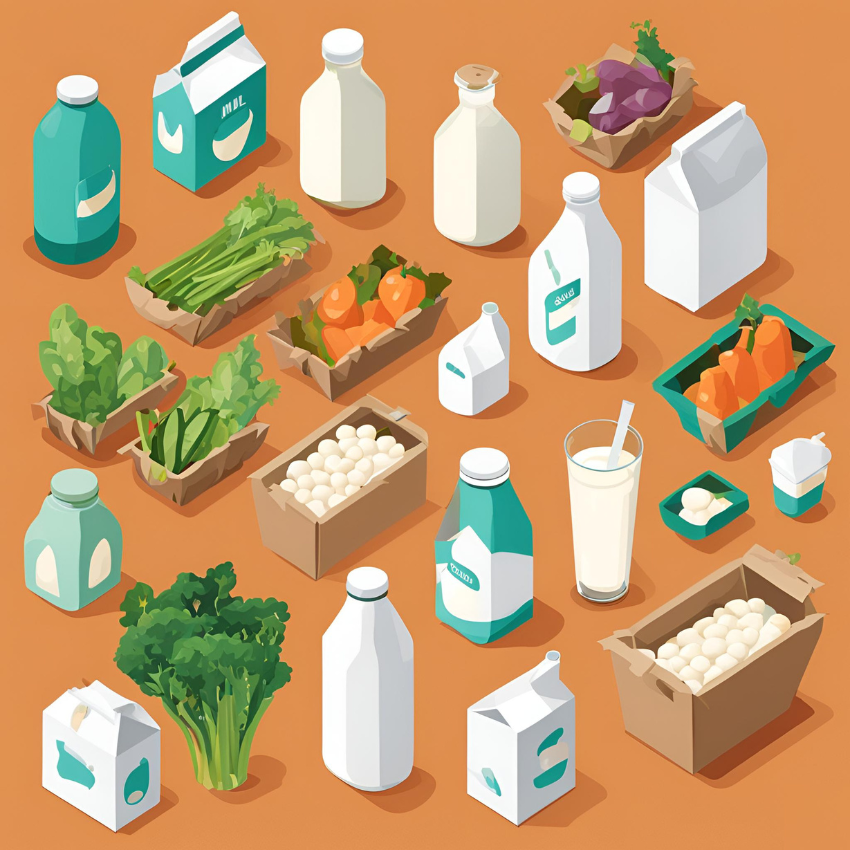
More packaging can now be accounted for in your report. Š copyright Farm Carbon Toolkit – AI Generated

We listened to feedback and added more options to help record unique purchases on your farm for your carbon footprint report. All farms are different so you may not see all these changes but here are the main additions:

  • There are more material items accounted for in our already extensive list; things like sheep hurdles; packaging used by dairy producers and in veg boxes; and a range of cleaning products, detergents and disinfectants
  • More items thrown away or disposed of can be simply accounted for by selecting options from our extensive list
  • If you produce your own hay and haylage this can be recorded, alongside silage and straw, feed and bedding. Following our updates to crops on-farm, this detail allows more of what you do to be recorded – though it doesn’t necessarily result in emissions calculations. You’ll find full details of what creates emissions within the calculator as you enter each item, and in our methodology and update note.

Your own feed haylage, silage, and more can be recorded in your report. Š copyright Farm Carbon Toolkit – AI Generated

Better visibility of Greenhouse gas type and scope

When a report is downloaded in CSV or JSON formats you will now receive a more detailed split of greenhouse gas for each item on your report, which is also broken down by emissions scope. We’ve been asked for this from farmers and agricultural professionals using the calculator – often those reporting onward emissions to others in the supply chain looking for this detail. 

Your reports won’t change

We know consistent reporting is important to you so we have ensured carbon reports in our system will not automatically change because of this update. This means all your calculated figures will stay the same.

Do note however that if you modify an old report by adding items to it, or if you click ‘recalculate’ then your report will update in the relevant places based on this update. You may want to update it, particularly if you have crops in your report, as you may want to see changes due to the improved accuracies mentioned. 

If you want to preserve your old report but also change or build scenarios from it, you can lock your report so it cannot change and create a copy of any report from your dashboard to begin making alterations. Name these reports so you can easily tell them apart. Talk to us if you are not sure and we can advise you.

When is our next update?

These updates are scheduled to take place at least twice per year with an incremental update in Autumn and a larger annual update in Spring. 

We are here for farmers and users and our updates like this reflect all our priorities. We engage our farmer network and the Farm Carbon Toolkit team in the update process by gathering feedback on how the current version is working alongside suggested improvements. We order the feedback we receive by quality and what is achievable, and plan our next upgrade in accordance with our ongoing schedule.

We’d love to hear from you

Our friendly team can be reached to help answer your questions – talk to us.

Remember there are a range of resources for users of the Calculator and useful FAQs and videos too.

Your Farm Carbon Calculator Team – October 2024

Lizzy Parker – Calculator Manager

James Pitman – Calculator Development Officer

Grace Wardell – Calculator Development Officer

Izzy Garnsey – Data Scientist

Calum Adams – Calculator Data Assistant

Michael Brown – Customer Service Officer

Farm Carbon Toolkit – meet the team

New Calculator Updates – April 2024

The FCT Calculator team has released a significant update to the Farm Carbon Calculator, designed to ensure that your reports reflect the latest emissions data and understanding available. This update, which will affect any reports ending after 1st April 2024, encompass a range of improvements aimed at enhancing report accuracy, flexibility and calculator usability. Below are some of the main changes you will see to the calculator.

Updated emissions factors

We want to ensure that your reports align with the most recent scientific research and methodologies, and to that end we have updated our emissions factors across various categories, including: 

  • Updated UK GHG Inventory factors to the latest data (affects fuels, materials, distribution, processing, inventory and waste)
  • Updated the livestock, cropping and input emissions factors in line with the most recent IPCC standard refinements
  • Updated woodland sequestration factors in accordance with the latest Woodland Carbon Code

Numerous other emissions factors have been updated across the calculator, and for a more extensive breakdown of these changes, see Table 1 of our “What’s new for April 2024 update” document on the Calculator resources page.

New factor options

In this update we have also expanded the options available when report building to offer more comprehensive coverage of farm businesses. The new factors we have added include:

  • New fuel options such as alternative diesels and purchased heat and steam
  • Diverse new material options, such as more fencing materials, piping options, packaging choices, and agricultural consumables.
  • Expanded imported organic fertility and cropping options, including whole cropping
  • New fertiliser (including liquid fertilisers) and spray options, with provisions for unlisted items
  • Inclusion of hay and haylage as livestock feed options
  • Expanded distribution options, including electric vehicle haulage and various air freight options

Alongside adding new options, we have provided some more refined options for existing factors in the calculator, including: 

  • New managed hedgerow options, to allow reports to reflect the higher biomass accumulation of young hedges
  • We now have a non-UK electricity option for international users, allowing you to input your emissions using your nation’s specific emissions conversion factor
  • More options for structures, including new agricultural building size options and various new complete fencing options

A full overview of the new additions and refined items are available in Table 2 of the “What’s new for April 2024 update” document, as well as flagged in the new data collection sheets available on our Calculator resources page.

Accounting for Capital Items

With this update we have provided more flexibility in how capital items (such as farm machinery or agricultural buildings) are accounted for to ensure that your reports are in line with your desired reporting approach. You can choose to account for capital items in two ways:

  • “Depreciating over 10 years” – The legacy method with emissions “spread” over a 10 year period
  • “Upfront” – an approach which is compliant with the GHG protocol agricultural guidance. This way embedded emissions from capital items are associated with the year they were purchased, and only the emissions from your reported period will be included in your report

Not all standards require the inclusion of capital items, so if you are producing a report for someone else you should check whether they want capital items included. 

You can also switch between inventory reporting options by going to “Edit Farm Details” and you will not lose any data switching between the two.

Reporting waste

A new waste disposal reporting approach has been developed to ensure there is an accurate assessment of emission and these are accounted for in a GHG protocol compliant manner. How waste is reported can be selected on the report information page as with the new inventory options:

  • “Legacy” is the existing approach which compares emissions from disposing of wastes to what would have been emitted had the waste been sent to landfill (i.e. it includes “avoided emissions”)
  • “GHG protocol compliant” is the new recommended option as it discounts any “avoided emissions” and accounts just for the emissions resulting from the disposal method selected

New Data Collection Sheets

To facilitate data collection, we provide updated sheets with all new calculator items flagged for easy reference. You can find these on our Calculator resources page.

More information

For a more detailed overview of these changes and the methodologies behind them, please visit our Calculator resources page. Additionally, our website offers various help and guidance to assist you in reporting your farm businesses’ carbon footprint.

We are dedicated to providing an accurate and user-friendly carbon calculator that can help farmers improve their business and environmental resilience. This update has been the product of the hard work from our team in response to contributions and feedback from our users, so if you have any queries or insights for the calculator please email us at [email protected], and we will work to make this the most accessible and informative tool for you.

How to avoid ‘double counting’ your carbon

Carbon accounting is a fast-moving space, and here at FCT, keeping on top of best practices is one of our top priorities. We commission regular external reviews of all our emissions factors to make sure we’re as compliant and up-to-date as possible. And yet even with the best data available, there’s always the possibility of human error (we all do it!) cropping up in a carbon report. 

One area we’re particularly keen to address is how to avoid ‘double counting’ when it comes to farming footprints. This refers to counting the same carbon/CO2e in different places, often (but not always) in the same report. 

For example, you might record all your freight and logistics fuel use in the ‘Fuels’ section of our Calculator, only to duplicate the entry under the ‘Distribution’ section. This would result in counting the same emissions twice, artificially inflating the total emissions figure. 

These errors can be subtle and easy mistakes to make, so it’s worth reading on to find out how to avoid them and embrace best practices.

How is double counting possible?

Our Carbon Calculator has many different emissions factors that you can record, reflecting the wide variety of needs and business profiles in modern farming. Because of the need for informative metrics and KPIs, our Calculator sometimes offers the option to record an emission or offset in more than one section. 

You can therefore choose to either record all of the carbon in one section, or to split it out for better insight in your final report. For example, you may want to be able to see the amount of fuel used in farming operations vs. the fuel used in the distribution of goods. Being able to record the carbon in more than one place is crucial to business insight, but it does introduce the risk of error. 

If we want to use these informative metrics, then it’s important to be aware of when you might double-count your carbon. 

Where in the Calculator might I be double counting?

We’ve listed below some of the most common areas where double counting may occur in our Calculator. For each one we’ve given an example of how it occurs, and the best practice in order to avoid it. 

Animal Feeds – Home grown vs. Bought in 

If you are growing your own animal feed on-farm, then you don’t need to account for this in the ‘Livestock’ section. To do so would overestimate your emissions. The Livestock section is only for feeds that are specifically bought in.

To avoid the double count: Make sure that anything recorded as a feed in the Livestock section is a bought-in feed. If not, it doesn’t need to be counted there!

Materials vs. Inventory

The Materials section of our Calculator allows you to record a wide variety of items that are used in construction and repair work. Our Inventory section, on the other hand, is there to record larger capital items such as new outbuildings or farm machinery. This difference is key, as any items within the Inventory section will have their carbon impact depreciated over a period of 10 years.

It’s also possible to record your own custom building projects inside the Inventory section. For example, you might choose to record all the materials associated with a new outbuilding. This might be done so that you can achieve a more precise footprint for a non-standard construction. 

Where materials are purchased for running or regular repairs of existing installations, record these in the Materials section.

To avoid the double count: Make sure you’re not recording any custom-build projects in both Materials and Inventory. They only need to be recorded in one of these sections!

Sequestration – Double Counting Offsets 

If you have previously sold any carbon offsets, for example through soil organic carbon sequestration, then you should not count the offset in your report. To do so would be an example of double counting as the benefits are no longer attributable to your farm business. 

To avoid the double count: Make sure you’re only recording potential sequestration that hasn’t been sold or accounted for elsewhere. 

Sequestration – Double Counting potential sequestration

If you have entered an area of land under the sequestration option: “Soil Organic Matter” or “Soil Organic Carbon” (using information from soil sampling), you should not also enter those areas of land under other sequestration options (such as Countryside Stewardship Schemes, even if the land is receiving payment for that scheme). Direct soil sampling is preferable in this scenario. Similarly, whilst in practice you can “stack” the payments you receive from stewardship grants, you must only enter areas of land for sequestration under one potential sequestration option (so if “My field” is 5ha, I can enter soil sampling data from those 5ha OR the fact that they are under a Countryside Stewardship Scheme).

To avoid the double count: Include each field area under only one potential ‘Sequestration’ option.

Fuel Use – Distribution vs. Farming Operations 

If you want to split out your fuel use into distribution and farming operations, you have the option to record these separately. Any farm fuel use such as red diesel can be recorded under ‘Fuels’. Any fuel used in moving goods can be put under ‘Distribution’. 

To avoid the double count: We recommend splitting out fuel use between ‘Fuels’ (i.e. farm operations) and ‘Distribution’.

The Exceptions

As with all good rules, there are some apparent exceptions:

  • you CAN add multiple crops that have been grown on the same area of land in the same year (but only include those that have been harvested or terminated within the reporting period). 

Free-to-Use Equine Carbon Calculator

Taking The Reins: Equine Carbon Calculator Launched to Inspire Environmental Action

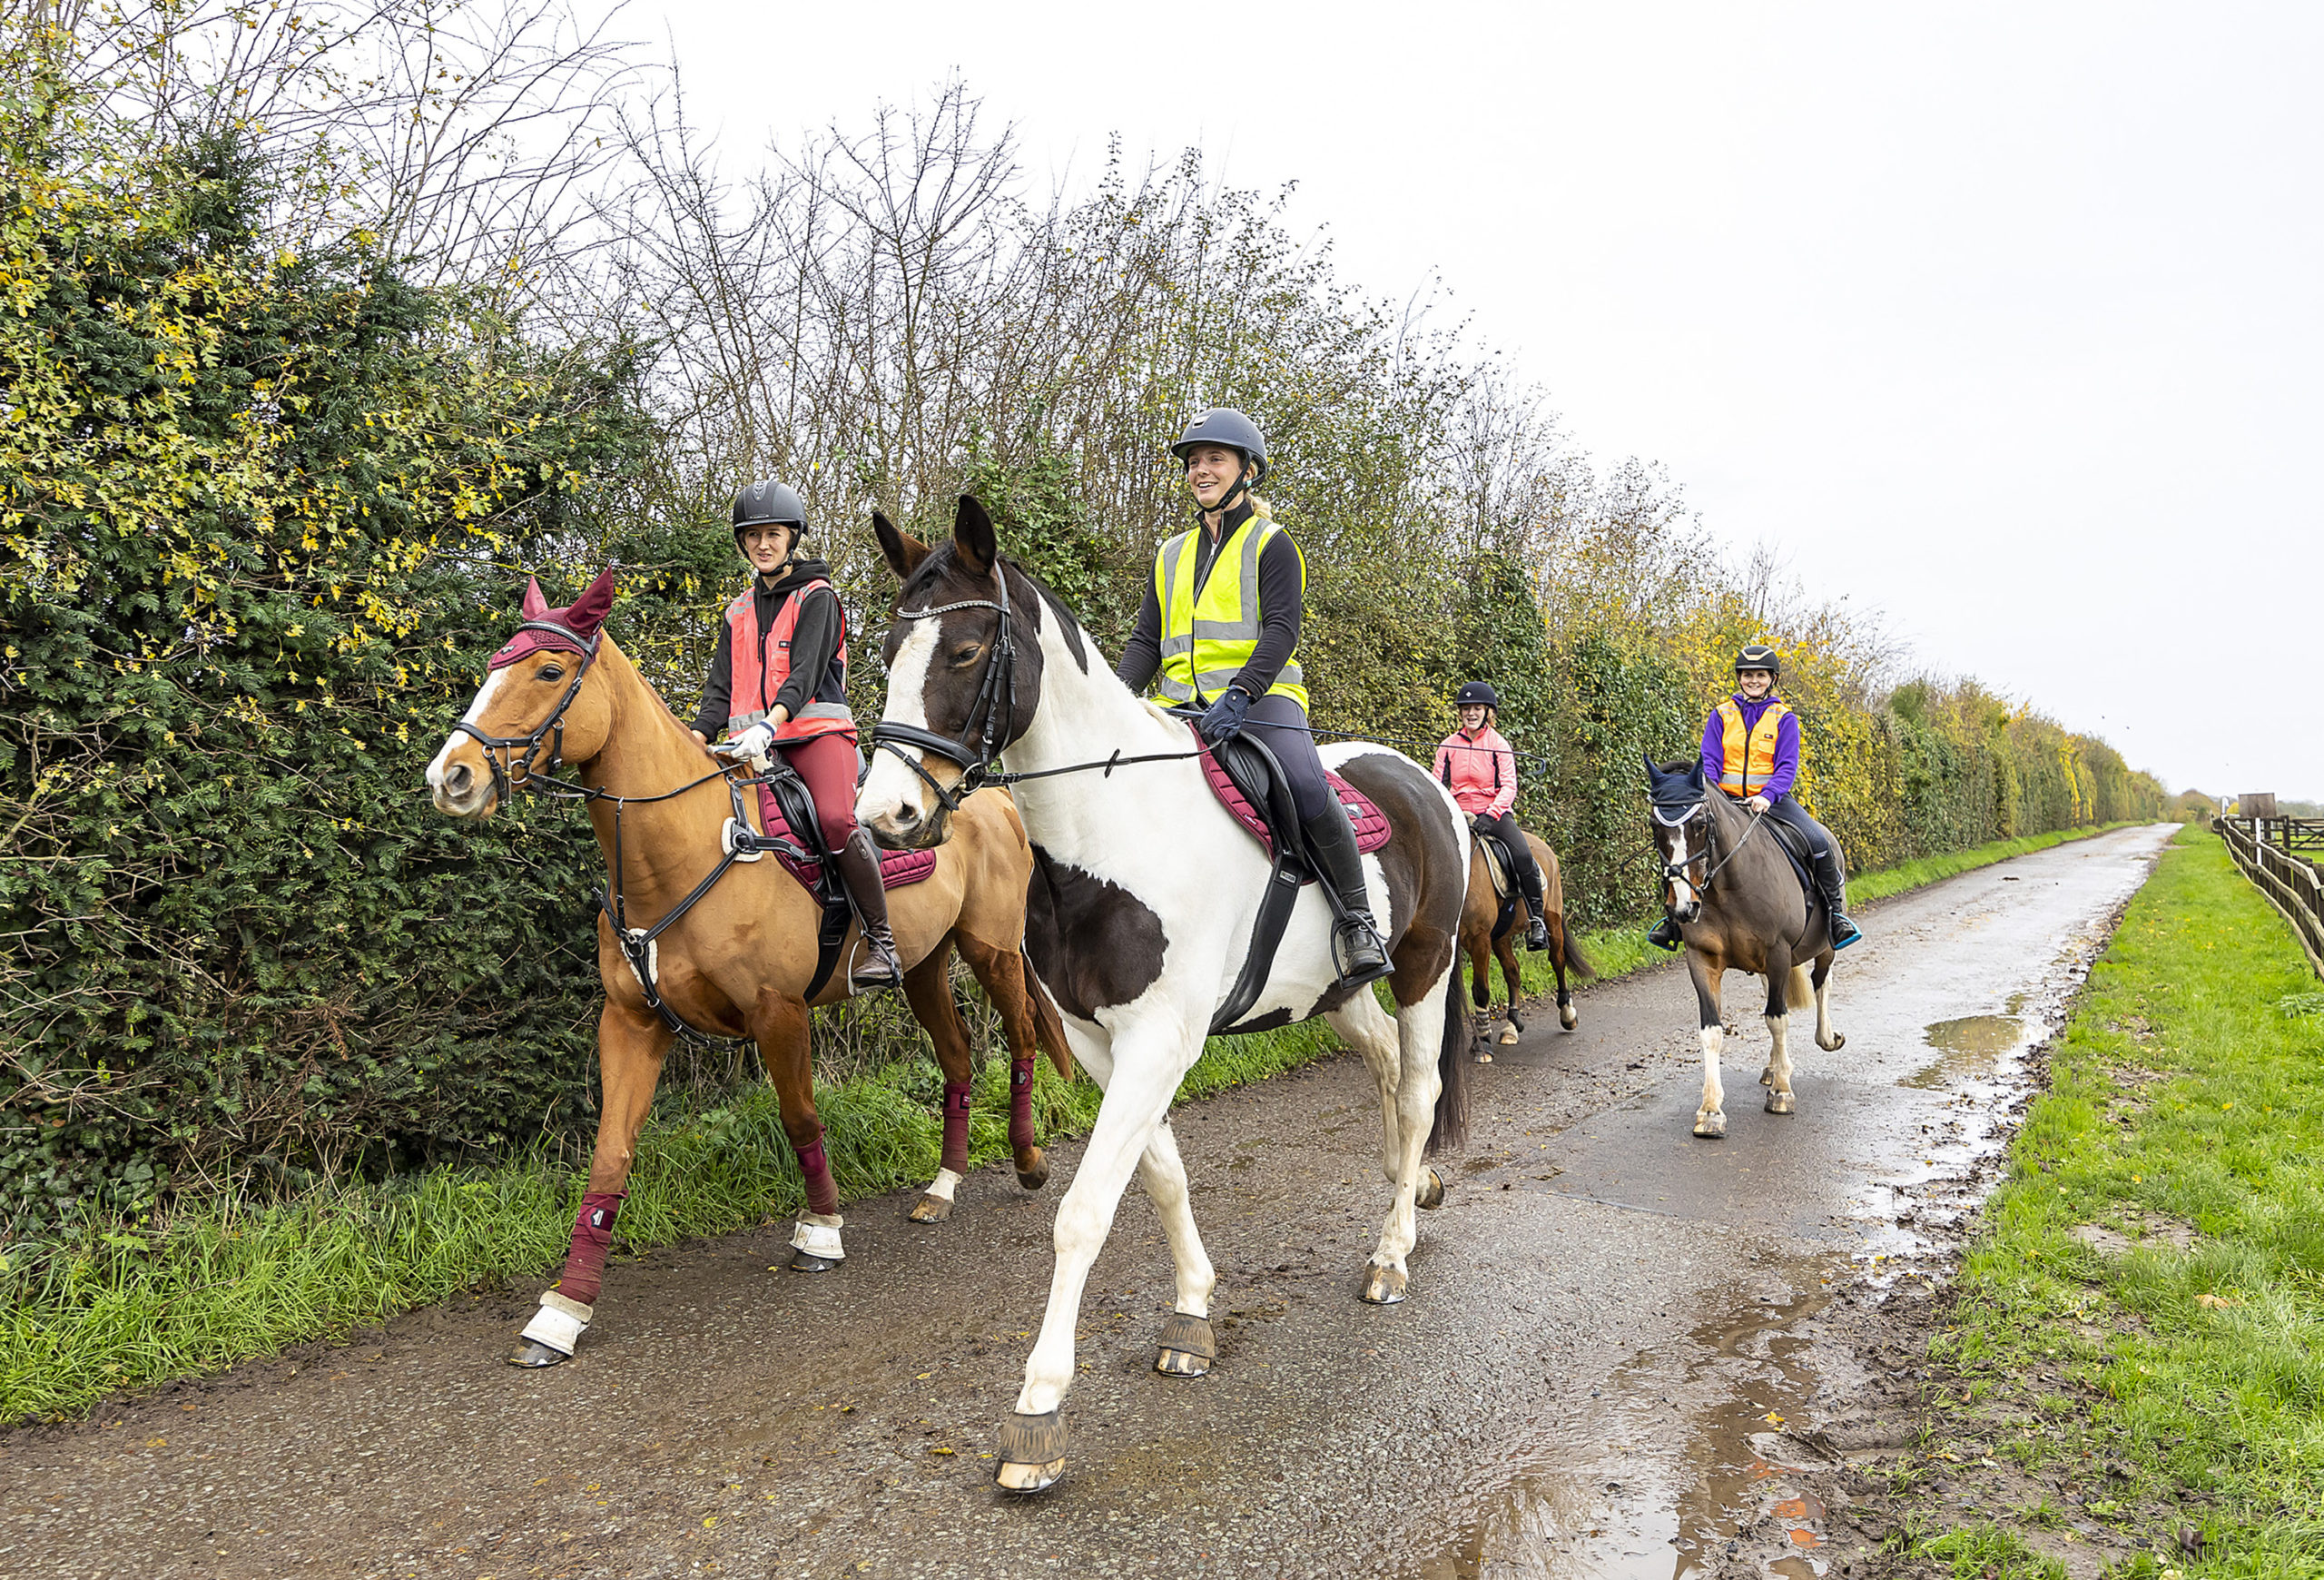
A consortium of equine organisations is rallying the industry to play a leading role in addressing the climate crisis and shaping a better future, with the launch of the first nationwide equine carbon calculator today.

Pioneered by equine environmental sustainability specialists White Griffin and the Farm Carbon Toolkit, in partnership with Derby College Group, Hartpury University and Sparsholt College Group, the calculator has been developed to empower equine businesses and horse owners to better understand their environmental impact and take meaningful steps to mitigate it.

The free-to-use tool – accessible here – also identifies opportunities for businesses to minimise their energy costs and maximise their potential to regenerate the countryside.

While carbon footprint tools are prevalent in the agricultural sector and play a pivotal role in government carbon reduction targets, no such tools have been available at scale for equine premises until now.

Without insights into the scale of the challenges and opportunities, the equine industry is hindered in setting meaningful targets. The equine carbon calculator seeks to bridge this gap, empowering stakeholders to make informed decisions for a sustainable future.

Director of White Griffin, Ruth Dancer said:

“The equine community holds a deep connection to the natural world, so we have a unique opportunity to safeguard it for future generations. By implementing the equine carbon calculator, we can better understand our emissions and find innovative ways to reduce them, saving money and paving the way for a better future.”

The launch of the carbon calculator marks the beginning of a comprehensive campaign to educate and inspire the equine industry on environmental sustainability. This initiative will be complemented by a suite of resources set to launch in autumn, offering support to stakeholders across the horse racing and equestrian sectors.

It follows a broader industry shift toward a more sustainable future for equestrians and horse racing, underscored by the tangible impacts of climate change on the industry. Following the hottest year on record in 2023 coupled with significant flooding, the UK equine industry suffered multiple cancellations across the full spectrum of events, highlighting the urgency of addressing these challenges. 

White Griffin’s previous reports for the British Horse Racing Authority and the British Equestrian Federation, have laid strong foundations for these sustainability initiatives, emphasising the need for tools and resources to support businesses in their sustainability efforts.

Farm Carbon Toolkit project lead, Lizzy Parker said,

“After years of supporting agricultural farms with reducing their environmental impact through a clear and easy-to-use tool, we know how important measuring to monitor is. Our calculator allows equine businesses to properly understand their carbon footprint and make the necessary changes to reduce their emissions.”

The equine carbon calculator is the result of a collaborative effort among academic institutions committed to driving real change in the industry.

The project began when Assistant Principal of Derby College Group, Jon Collins, began work on their own carbon footprint and discovered that while the tool had everything they needed to understand the farm’s footprint, they struggled to use it for their equine yard. Speaking with Sparsholt College Group and Hartpury University, Collins discovered that both organisations were also seeking to develop a tool to support their equine students and businesses and therefore a collaboration was formed in order to pool resources. Collins said,

“I chose Farm Carbon Toolkit to develop the resource because I found their tool to be easiest to use and provided the best user experience. Understanding the busy lives of equine business owners, we knew that we had to develop something that was clear, useful and also provided invaluable insight and comparisons with other equine businesses. We are proud to be delivering this with the support of Landex and will be rolling the tool out to all students, organisations and interested individuals who are seeking to make a difference in their day to day lives to the environment we all depend on.”

Project lead for Hartpury University, Rachel Collins, said: “We’re passionate about sustainability at Hartpury and have worked with both White Griffin and Farm Carbon Toolkit to deliver the most up-to-date training and knowledge to our students on equine sustainability. This tool represents an important step in our commitment to drive the industry forward towards a sustainable future. We are proud to be part of this collaboration, leveraging our expertise to empower stakeholders and effect meaningful change.”

Mark Treagust, Vice Principal of Sparsholt College Group said: “Collaboration within the equine sector is vital to address our industry’s greatest risk – the climate crisis. Leveraging our collective wealth of knowledge in land management and equine welfare, we must support businesses in making impactful changes. This tool initiates a large-scale process for thousands of individuals all over the country. By uniting as academic institutions and utilising the Landex network, we can effect real, much needed change.”

Farm Carbon Calculator External Review Completed

Farm carbon calculator logo

By Liz Bowles, Farm Carbon Toolkit Chief Executive

Having confidence in the accuracy of the Farm Carbon Calculator

In a recent blog post, we explored all the factors that influence the accuracy of carbon footprint, from the data the user inputs, through to the processes that ensure the Farm Carbon Calculator’s calculations and emissions factors are correct, and the ongoing testing carried out. However, like any good service, we understand that you want independent experts to endorse our tools.

Feeling confidence from external experts

Like any good service provider, we actively and regularly seek external review of our tools. In autumn 2023 we asked the independent global climate consultancy, the Carbon Trust to review our Calculator, including the methodologies, calculations, assumptions and factors that underpin a working calculator against the GHG Protocol standards. Following this review, we have developed an Action Plan to address issues identified which will be completed by December 2024.

Alongside this work, Defra commissioned ADAS to look at a number of leading UK Carbon Calculators to improve our understanding of the differences between them and to support methodology harmonisation going forward.Our Calculator was one of those included in the comparison. A key finding from this work was that although there are many ways to complete a carbon footprint inaccurately there is no “one way” of doing it accurately. This is mainly because the different Calculators compared are seeking to answer slightly different questions.

The differences identified were found in the areas of scoping, emissions factors used and standards aligned with

Scoping describes what is measured, and some calculators include things that others don’t. At the Farm Carbon Calculator, for instance, we measure as much as possible of a farm business. This includes, for instance, the embodied energy in buildings and machinery, upstream emissions of various inputs, and gives the option to estimate all potential carbon sequestration on farm. Not all calculators go this far.

There are some standard and some non-standard emissions factors used. For instance, the UK Government produces a comprehensive list of emissions (UK GHG Inventory & Conversion Factors) from fuels and energy, livestock and crops that all calculators will use. But some of the other factors come from a range of other scientific papers and there may be some variability in which ones are used by different calculators. All calculators currently carry out their own research independently of each other.

The UK Department for Energy Security and Net Zero publishes annual updates to emission factors

There are a number of standards that describe what and how to measure carbon footprints. Whilst there are a number of standards that relate to food and farming, there is a lack of consensus over which standard is ‘the one’ to adhere to. We are therefore implementing a process whereby users can choose to align their carbon reports to one of a few recognised standards. This will be available in due course.

You can find the full report and recommendations in the ADAS Report for Defra.

Following this report, we are working actively to support higher levels of harmonisation where this is possible to reduce results variability from different Calculators. 

Hopefully, this gives you, our valued users, confidence that we are rigorous in our processes, that we conduct regular independent reviews, and that we are fully engaged with industry, Government and reviewers to improve and meet the expectations of a maturing sector.

As an organisation that exists to help farmers and growers measure, understand and reduce their carbon footprint,  we always operate in the best interests of our users which includes ensuring our Calculator is as accurate as possible at all times. We are independent, providing a free carbon calculator for farmers and growers, and have a process of continual improvement in place. As a regular user of our Calculator, you can always compare current and past results using the most up-to-date Calculator, allowing you to track business progress to net zero.

You can find all you need to know about the Farm Carbon Calculator here. If you need more information please contact us at [email protected] or phone us on 07541 453413.
Building trust in Carbon Calculators in Agriculture

Farm carbon calculator logo

By Liz Bowles, Farm Carbon Toolkit Chief Executive

In a recent blog post, we explored all the factors that influence the accuracy of carbon footprint, from the data the user inputs, through to the processes that ensure the Farm Carbon Calculator’s calculations and emissions factors are correct, and the ongoing testing carried out. Here we would like to tell you about how we are involved with activity to support Calculator harmonisation to increase levels of trust in all UK Farm Carbon Calculators.

Defra is very keen to support the agricultural sector in embracing greenhouse gas accounting. To this end in 2023, they commissioned ADAS to look at a number of leading UK Carbon Calculators to improve our understanding of the differences between them and to support methodology harmonisation going forward. Not surprisingly the differences between the Calculators investigated arise from three main areas – scoping, factors and standards.

Scoping describes what is measured, and some calculators include things that others don’t. At the Farm Carbon Calculator, for instance, we measure as much as possible of a farm business.

There are some standard and some non-standard emissions factors used. For instance, the UK Government produces a comprehensive list of emissions (UK GHG Inventory Conversion Factors) from fuels & energy, livestock and crops that all calculators will use. But some of the other factors come from a range of other scientific papers and there may be some variability in which ones are used by different calculators. 

There are a number of standards that describe what and how to measure carbon footprints. Whilst there are a number of standards that relate to food and farming, there is a lack of consensus over which standard is ‘the one’ to adhere to.

Guidance for all carbon calculators

A series of recommendations for all Carbon Calculators, Industry and UK governments were made by ADAS as a result of this work – ADAS report . Here we list those recommendations and how we are implementing them.

SectorWhat is the ask?What is FCC doing?
Industry and GovernmentClearly define the scope required for farm level carbon assessments and how they will be usedWe are actively working with industry bodies to harmonise the way emissions data is collected and calculations are made
CalculatorsAlign with the requirements of the latest standards and guidance – currently GHG Protocol standardsFollowing our Carbon Trust Review we are implementing our agreed action plan to ensure full alignment with the GHG Protocol
CalculatorsRegularly review and update Calculators to account for changes in scientific knowledge, carbon accounting methodologies and new emission factorsWe update the Calculator in spring and autumn each year, covering all three areas outlined in the recommendation
CalculatorsComply with the latest IPCC guidanceWe already adhere to IPCC guidance
CalculatorsTo use emission factors from agreed sources for the embedded emissions in fertilisers, feed and fuelsWe base emissions factors on the GFLI database, which is considered the most robust source of this data. However, we would welcome a more UK-centric database which is required to be used by all Calculators. Agricultural carbon tools have been struggling with the challenge of embedded emissions in purchased livestock for years
IndustrySupport the development of appropriate emissions factors for the embedded emissions in purchased livestock
CalculatorsPresent outputs in compliance with the latest standardThrough our adoption of the Carbon Trust Recommendations our outputs will align with the latest standards
Government and industryDefine consistent disaggregated output categories for use by all calculators.(not applicable)
Calculator providersBuild user confidence through transparency of approach and third-party verification of the alignment of calculators to minimum standardsOur methodology is freely available on our website and we annually carry out an independent review of the Farm Carbon Calculator

Alongside the work of ADAS, FCT is working with other UK Calculators as well as industry bodies such as Dairy UK to support more rapid harmonisation to reduce report results variation for farmers. Watch this space!

As an organisation that exists to help farmers and growers measure, understand and reduce their carbon footprint,  we always operate in the best interests of our users which includes ensuring our Calculator is as accurate as possible at all times. We are independent, providing a free carbon calculator for farmers and growers, and have a process of continual improvement in place. As a regular user of our Calculator you can always compare current and past results using the most up-to-date Calculator, allowing you to track business progress to net Zero.


You can find all you need to know about the Farm Carbon Calculator here If you need more information please contact us at [email protected] or phone us on 07541 453413

How to get an accurate farm carbon footprint report

Process of doing your carbon footprint report

When calculating the carbon footprint of a farm business, users should expect a result that is accurate, insightful, representative and replicable. However, farmers and growers can sometimes be unsure what the results from different carbon calculators mean, and why they are different. In general, it is good practice to find a carbon calculator which works for you and stick with it. Many calculators provide their methodology which demonstrates transparency and is a feature which users should look for.  In this blog we walk you through the process, and what affects the reports produced.

Inputting data into Carbon Calculators

Before starting the process of collecting data from your farm business, scoping is an important first step in understanding what’s in and what’s out of the report. For instance, a farm might have different enterprises, such as arable farming, a farm shop and some business units. Reporting on those enterprises separately makes sense from the perspective of understanding the carbon footprint of farming operations. In many instances, it is important to understand who the report is being completed for. Completing a whole farm footprint ensures that no details are overlooked and enables users to estimate farm carbon removals as well as emissions. However, increasingly the customers of farmers and growers are keen to understand the emissions associated with the products they are buying.

It should be noted, however, that producing separate reports that focus on the product can lead to overlooking important parts of a farm as a system – those parts of the farm that keep the system working but don’t directly result in a product.

Time period for the report 

This is generally over a 12-month period and can coincide with business accounting or harvest year, whichever is most convenient. It is perfectly possible to carry out emissions reporting over shorter periods to coincide with, for example, batches of livestock production. If you take this approach, be sure not to leave gaps between your reporting.

Data collection is a key part of the process and is generally undertaken by the business owner/employee. Getting this right is critical, and the quality of the data going in directly affects the accuracy of the results that come out. Our advice is quite simple – collect as much data as possible that is relevant to your business over the period to be reported on. We have a data collection spreadsheet to help with this part of the process https://calculator.farmcarbontoolkit.org.uk/resources

When entering data into the Calculator, it is important to ensure that data is entered correctly and in full. Users need to ensure that they’ve inputted everything collected in the data collection process and that units, decimal points and other important information are filled in correctly. There is much potential for error here, which will have a significant impact on the results!

Once data is entered and results can be viewed, interpretation of the report is very important. Is the report looking at a whole farm or enterprise footprint? Are you looking at the emissions only or the carbon balance? Are results being shown per hectare, per tonne, or for the whole business? Being clear about what has been measured, and what is being reported is crucial – particularly if comparing between different businesses or within a sector. 

Getting our bit right

As a provider of a leading carbon calculator for farmers, growers and food businesses, at Farm Carbon Calculator we take a huge amount of care in ensuring that we are getting our numbers right. 

Alongside your farm data, all Calculators will have a series of formulae and emissions factors which are used to calculate the farm’s emissions. Emissions factors tell us how much greenhouse gas is released from a certain activity – for instance using a litre of diesel in a tractor. At FCT, we do this on thousands of items! We update all our emissions factors on an annual basis, and sometimes more frequently if new and credible research comes along. 

Once we’ve entered the new emissions factors, which have to be backed up by rigorous and credible peer-reviewed science, we then test the Calculator to ensure that everything is working properly. This process is rigorous and any anomalies are corrected before the update goes live. We publish our methodology and references on our resources page. The next update is due in April 2024.

This ongoing process ensures that we are on top of the science, up-to-date, and maintaining a tool that users can expect to get accurate and reliable results from, in order to make informed decisions for their business.

Alongside getting the factors and formulae correct, there is increasing guidance on what needs to be included within any agricultural greenhouse gas audit and how the calculations should be completed. Examples of such guidance come from the draft Land Sector Removals guidance from GHG protocol which sets standards for how GHG accounting should be carried out and the Forest, Land and Agriculture Science (FLAG guidance) from the Science-based Targets Initiative (SBTi). At FCT, our Calculator has been analysed against the requirements of FLAG and our Calculator has been found to be well aligned with its requirements.

As an organisation that exists to help farmers and growers measure, understand and reduce their carbon footprint,  we always operate in the best interests of our users which includes ensuring our Calculator is as accurate as possible at all times. We are independent, providing a free carbon calculator for farmers and growers, and have a process of continual improvement in place. As a regular user of our Calculator you can always compare current and past results using the most up-to-date Calculator, allowing you to track business progress to net Zero.

You can find all you need to know about the Farm Carbon Calculator here If you need more information please contact us at [email protected] or phone us on 07541 453413 

In the next blog we focus on how we get externally reviewed, and are engaged with industry and Government to improve accuracy and standards.

Your beef enterprise: how to accurately estimate emissions and sequestration

To accurately estimate the emissions and sequestration from your beef enterprise, you will need to add data to the following sections of the Calculator:

  • When setting up the report, make sure you enter the area of grazing (grassland) as well as any non-agricultural land area and cultivated land (arable or horticultural)
  • Use the Livestock section and select beef cattle. Add as many entries as you need to cover your herd. For example, you may have two groups of steers with different liveweights or kept on the farm for different lengths of time. In which case, enter the steers from the first group with one liveweight and then the steers from the second group as a separate entry with their own liveweight. This will give you more accurate emissions from their enteric fermentation (gut methane).
  • To calculate the average head of livestock on the farm over a 12 month period, take the number in a particular livestock category per month (so you have 12 “snapshots”) add these together and then divide by 12. Our data collection sheet has a help sheet for this. For growing animals, you may want to use the same approach for calculating average liveweight (our defaults assume a midpoint liveweight through the year for growing cattle but growth rates won’t be linear so using the snapshot approach may be more accurate)
  • Livestock entries also capture the CO2 equivalent (CO2e) of the methane emissions from enteric fermentation and of the nitrous oxide (N2O) emissions from the animals’ manure over the course of the year. The Calculator asks you how this manure is managed as this has an impact on the N2O emissions
  • You have the option to input the average dry matter intake (DMI) per animal per day (kgDM/head/day). The DMI can be used to more accurately calculate the enteric emissions of the cattle, and if left blank, a simpler algorithm will be used that does not consider DMI
  • You will need to account for any supplemental feeding via the Livestock > Animal feeds option – this is for brought-in feeds that were produced off-farm
  • Account for all your fuel use, electricity use, consumables, inventory items and waste produced using the relevant sections (Fuels, Materials,  Inventory, Waste). However, if you also have a dairy herd or arable operation, you may prefer to create a separate report and use this as an Overheads report to apportion shared capital items and energy usage emissions between your enterprises. Watch our video to see how this works in practice.
  • We recommend getting your soil sampled and have a guide on how to do this effectively and affordably. By monitoring your soil organic matter or soil organic carbon over time you can begin to log sequestration rates in your grazed (or other) soils. Once you have two years’ worth of soil sample results, you can enter these in the Calculator under Sequestration > Soil Organic Matter (you will also need bulk density measurements and a record of the depth of the sample).
  • If you don’t have directly sampled soil data for all your soils, you can use our range of proxy values for different Countryside Stewardship and habitat classes to estimate how much carbon your soils may be sequestering year-on-year. You can also measure the length of any hedgerows and field margins (ungrazed) and enter these to estimate the carbon sequestered in them on a yearly basis.

The complexities of calculating livestock emissions

What do we mean by livestock emissions?

Emissions from livestock cover two broad categories:

  • Enteric methane emissions (this is the methane produced by the animals digestion)
  • Greenhouse gas emissions from the manure and slurry produced by the animals.

When you enter a group of animals in the Farm Carbon Calculator e.g. 100 dairy cows, the Calculator will consider both enteric methane emissions and the nitrous oxide, ammonia and methane emissions associated with the manure or slurry those 100 dairy cows produce over the course of 1 year.

It is really important to enter the average number of animals in a category over the course of the year rather than the total number. For example, if you have 100 dairy calves on farm for only 6 months of the year, you should enter 50 dairy calves. Otherwise the Calculator will have to assume that all 100 calves are on farm for all 365 days of the year, which would overestimate the enteric methane production and the amount of manure produced.

Why do the emissions associated with livestock vary?

In the Farm Carbon Calculator, we ask users to tell us the number of livestock in a range of different livestock categories. The emissions produced by animals will vary based on:

  • Number of livestock (more animals means more emissions)
  • Liveweight of animals (larger animals tend to produce more manure)
  • Type of livestock (ruminants produce enteric methane, monogastrics don’t. Each type of animal has its own “rate of excretion” and different animals’ manures produce methane at different rates)
  • Pregnancy and lactation (pregnant or lactating cattle produce more enteric methane for their size)
  • Manure or slurry storage (rates of methane and nitrous oxide, emitted indirectly through leaching and ammonia volatilisation, vary depending on how the manure is stored and for how long)
  • Where manure/ slurry is spread (if manure is spread, the type of land it is spread on will affect the rate of indirect nitrous oxide emissions through leaching).

What about slurry covers, storage bags, slurry bugs etc… ?

We are actively working on incorporating a lot more options into the Farm Carbon Calculator to allow users to give more detail on their manure management practices. We plan to include options in 2024 for sending manure and slurry to anaerobic digestion, adding detail on slurry pit coverage, storage timing, and different application or incorporation methods for slurry (e.g. trailing shoe versus splash plate).

We are also researching the possibility of including slurry bugs (bacteria that inhibit greenhouse gas production from slurry stores) and chemical nitrous oxide inhibitors (that reduce the emission of greenhouse gases when the slurry is applied to the soil) as options so that users can show the benefits of these in reducing their slurry emissions. Similarly, we would like to be able to include methane inhibitors that can help to reduce enteric methane emissions for livestock.. To date though, the quality of independent scientific evidence for these management practices is very variable and different products show variable results depending on the farm environment, so it is harder for us to give robust estimates of the effect they will have on a farm’s emissions.