
By Liz Bowles, Farm Carbon Toolkit Chief Executive
In a recent blog post, we explored all the factors that influence the accuracy of carbon footprint, from the data the user inputs, through to the processes that ensure the Farm Carbon Calculator’s calculations and emissions factors are correct, and the ongoing testing carried out. Here we would like to tell you about how we are involved with activity to support Calculator harmonisation to increase levels of trust in all UK Farm Carbon Calculators.
Defra is very keen to support the agricultural sector in embracing greenhouse gas accounting. To this end in 2023, they commissioned ADAS to look at a number of leading UK Carbon Calculators to improve our understanding of the differences between them and to support methodology harmonisation going forward. Not surprisingly the differences between the Calculators investigated arise from three main areas – scoping, factors and standards.
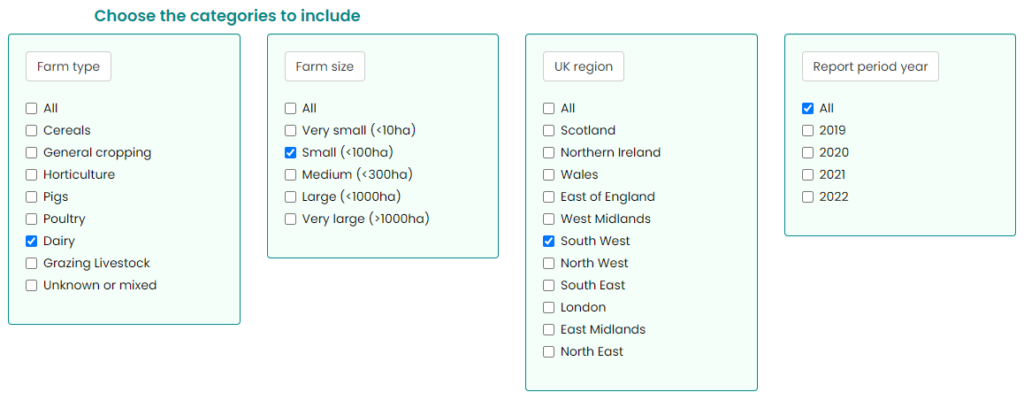
Scoping describes what is measured, and some calculators include things that others don’t. At the Farm Carbon Calculator, for instance, we measure as much as possible of a farm business.
There are some standard and some non-standard emissions factors used. For instance, the UK Government produces a comprehensive list of emissions (UK GHG Inventory Conversion Factors) from fuels & energy, livestock and crops that all calculators will use. But some of the other factors come from a range of other scientific papers and there may be some variability in which ones are used by different calculators.
There are a number of standards that describe what and how to measure carbon footprints. Whilst there are a number of standards that relate to food and farming, there is a lack of consensus over which standard is ‘the one’ to adhere to.
Guidance for all carbon calculators
A series of recommendations for all Carbon Calculators, Industry and UK governments were made by ADAS as a result of this work – ADAS report . Here we list those recommendations and how we are implementing them.
| Sector | What is the ask? | What is FCC doing? |
|---|---|---|
| Industry and Government | Clearly define the scope required for farm level carbon assessments and how they will be used | We are actively working with industry bodies to harmonise the way emissions data is collected and calculations are made |
| Calculators | Align with the requirements of the latest standards and guidance – currently GHG Protocol standards | Following our Carbon Trust Review we are implementing our agreed action plan to ensure full alignment with the GHG Protocol |
| Calculators | Regularly review and update Calculators to account for changes in scientific knowledge, carbon accounting methodologies and new emission factors | We update the Calculator in spring and autumn each year, covering all three areas outlined in the recommendation |
| Calculators | Comply with the latest IPCC guidance | We already adhere to IPCC guidance |
| Calculators | To use emission factors from agreed sources for the embedded emissions in fertilisers, feed and fuels | We base emissions factors on the GFLI database, which is considered the most robust source of this data. However, we would welcome a more UK-centric database which is required to be used by all Calculators. Agricultural carbon tools have been struggling with the challenge of embedded emissions in purchased livestock for years |
| Industry | Support the development of appropriate emissions factors for the embedded emissions in purchased livestock | |
| Calculators | Present outputs in compliance with the latest standard | Through our adoption of the Carbon Trust Recommendations our outputs will align with the latest standards |
| Government and industry | Define consistent disaggregated output categories for use by all calculators. | (not applicable) |
| Calculator providers | Build user confidence through transparency of approach and third-party verification of the alignment of calculators to minimum standards | Our methodology is freely available on our website and we annually carry out an independent review of the Farm Carbon Calculator |
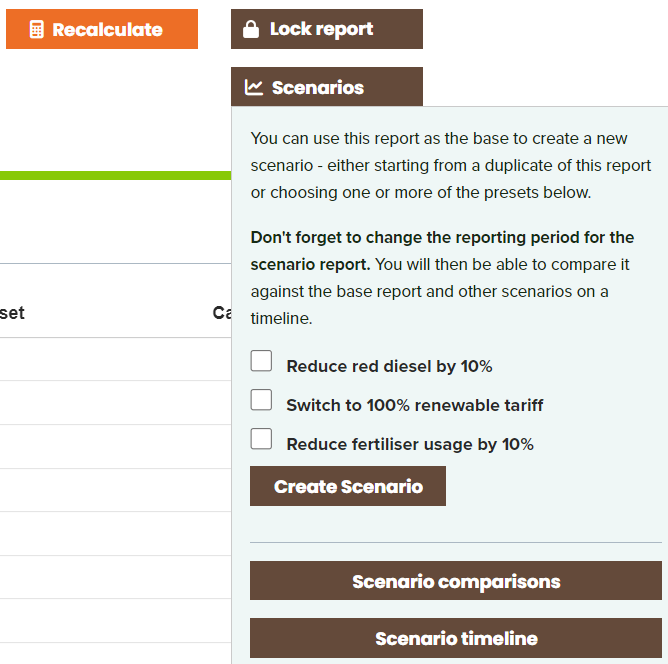
Alongside the work of ADAS, FCT is working with other UK Calculators as well as industry bodies such as Dairy UK to support more rapid harmonisation to reduce report results variation for farmers. Watch this space!
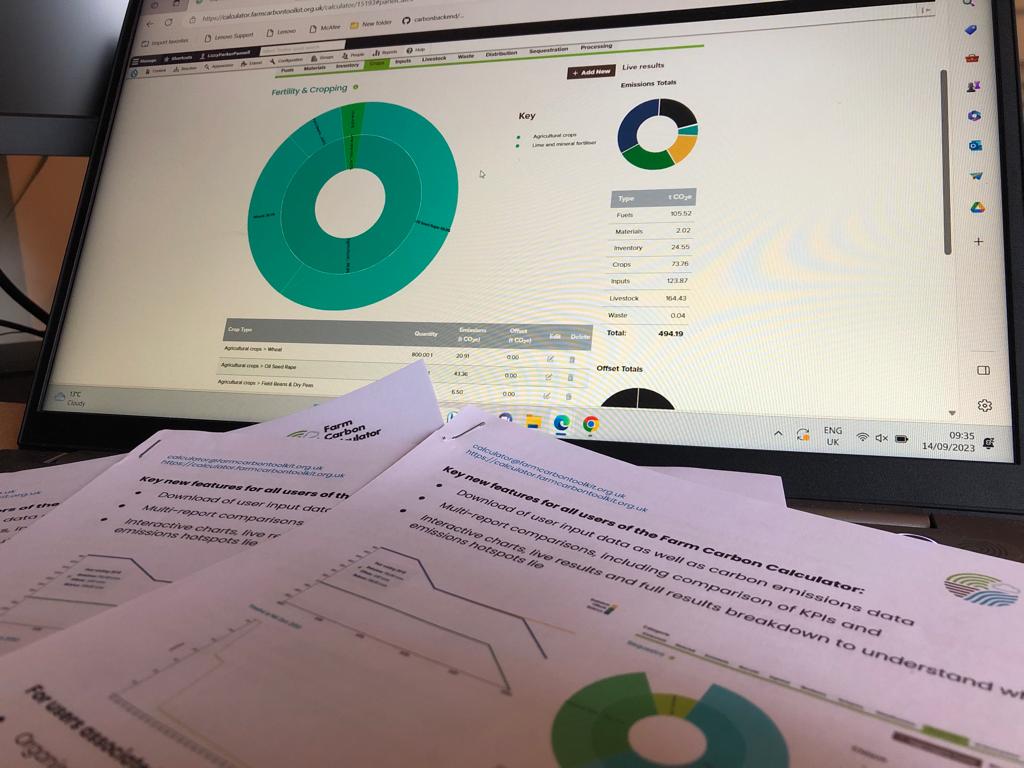
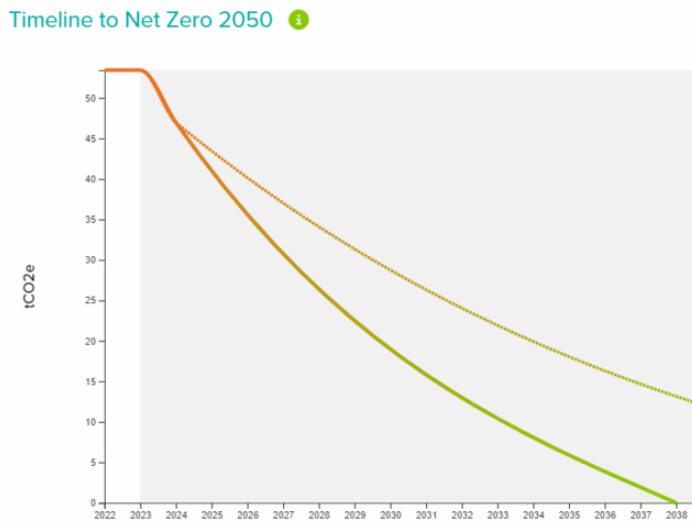
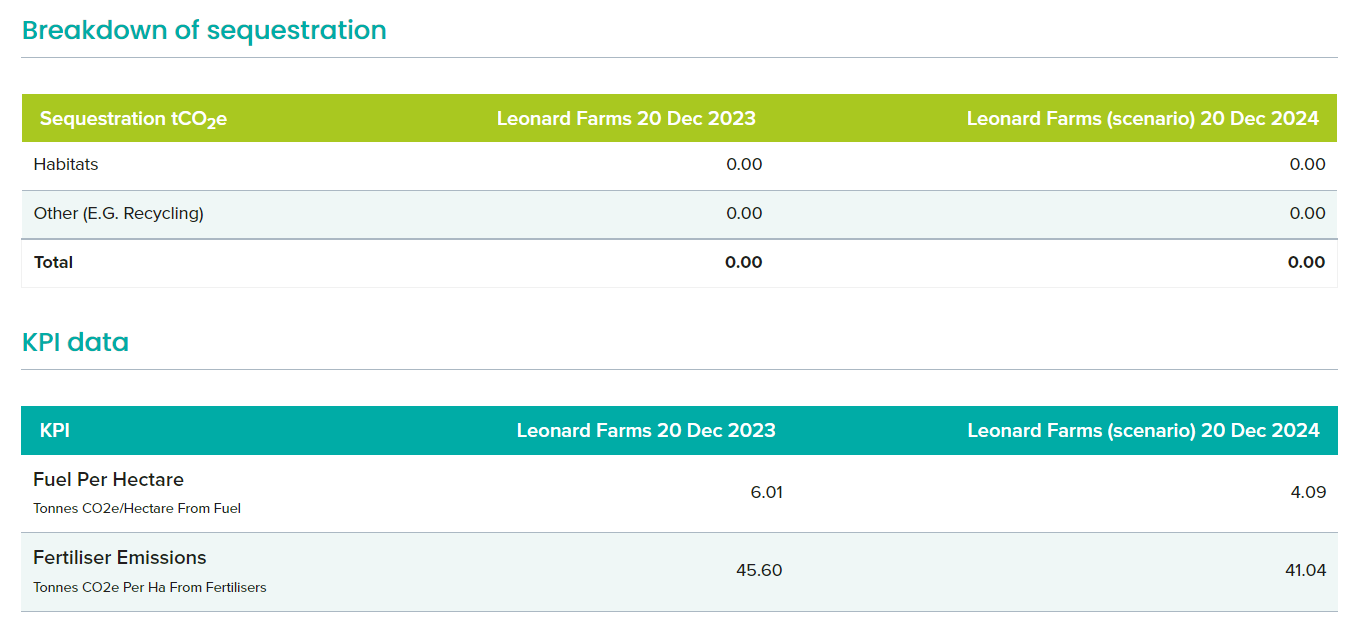
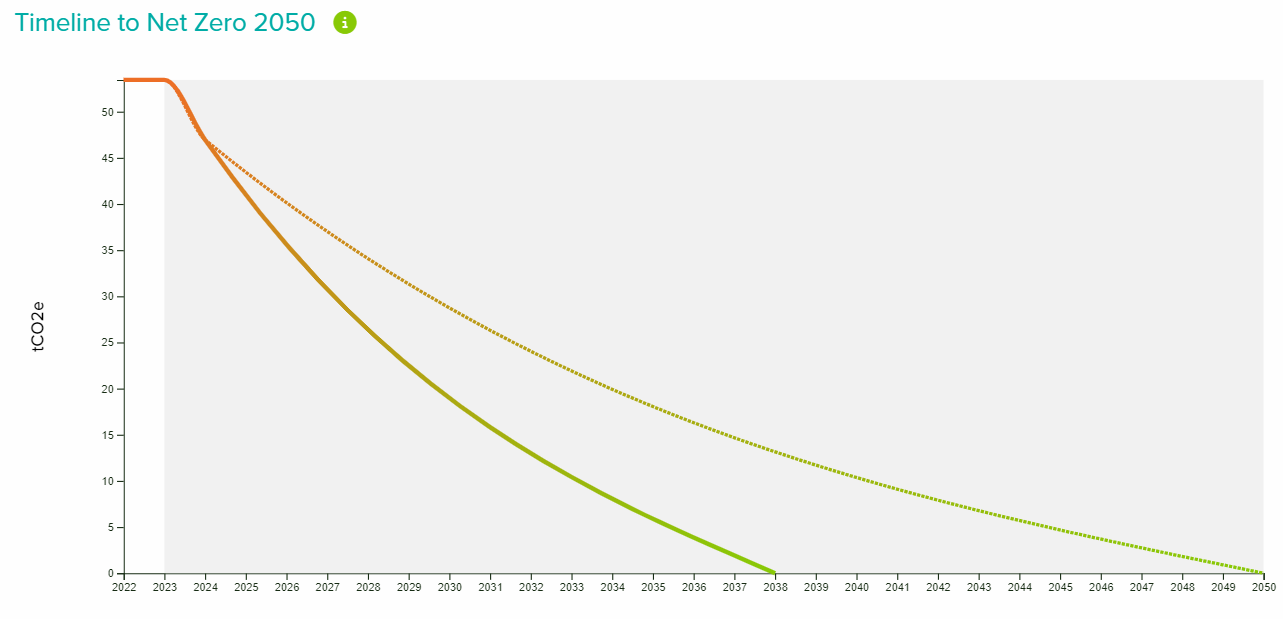
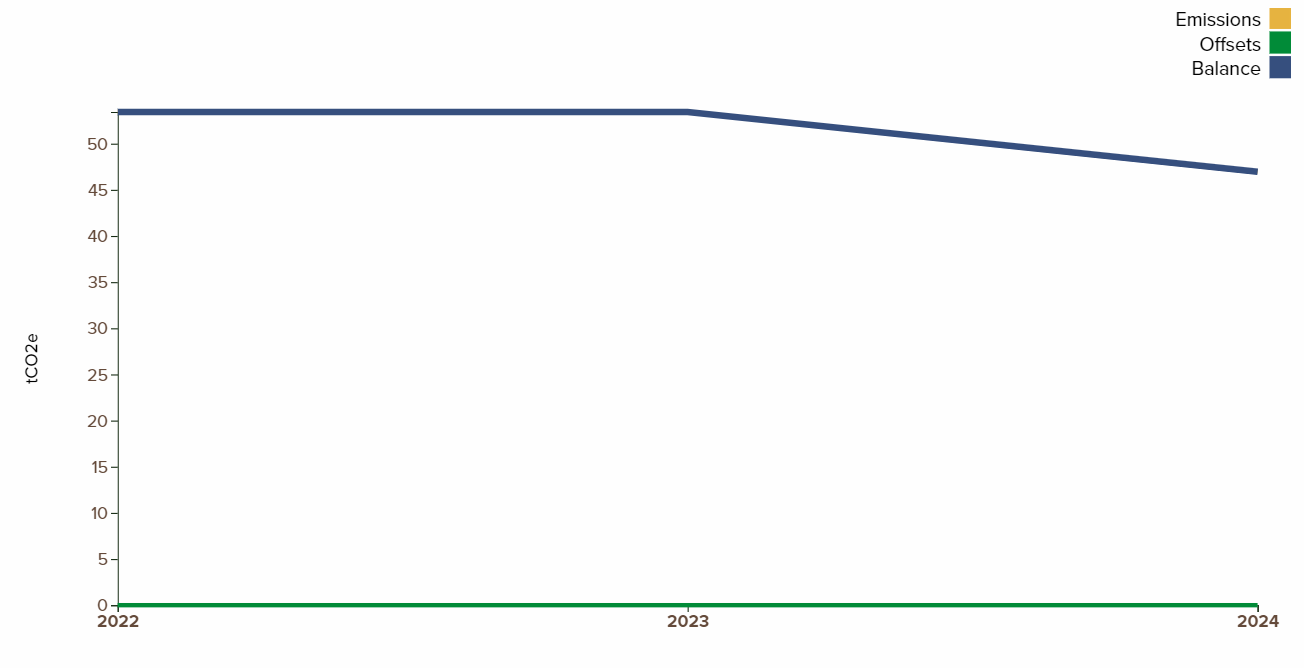
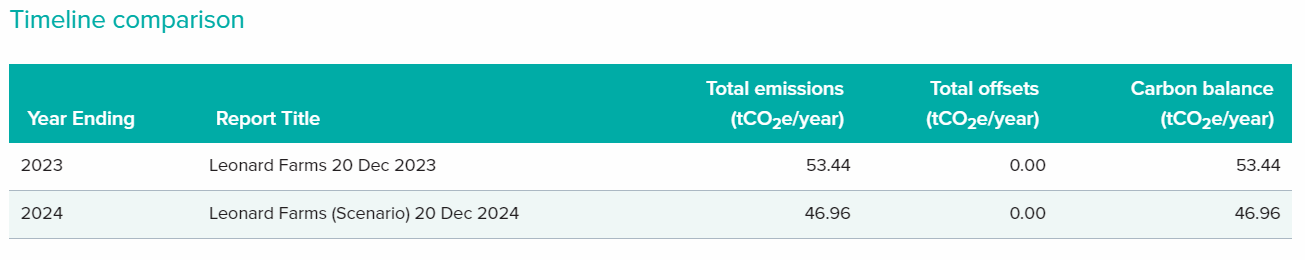
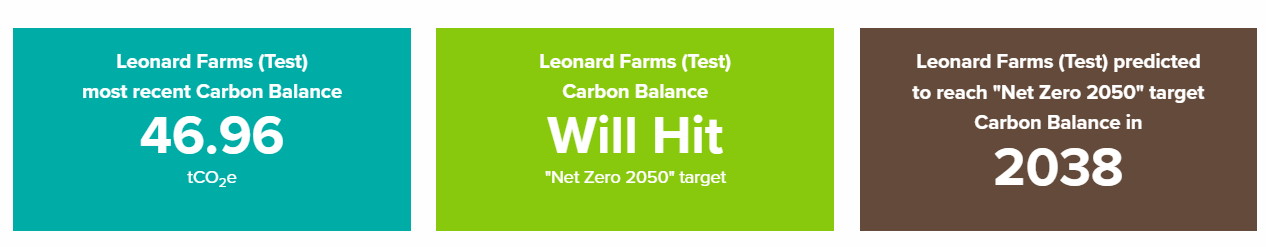
As an organisation that exists to help farmers and growers measure, understand and reduce their carbon footprint, we always operate in the best interests of our users which includes ensuring our Calculator is as accurate as possible at all times. We are independent, providing a free carbon calculator for farmers and growers, and have a process of continual improvement in place. As a regular user of our Calculator you can always compare current and past results using the most up-to-date Calculator, allowing you to track business progress to net Zero.
You can find all you need to know about the Farm Carbon Calculator here If you need more information please contact us at [email protected] or phone us on 07541 453413


Recent Comments