Tag: carbon

Examining GWP*: An Alternative Approach to Measuring Methane’s Impact

Cows

An overview of GWP* and the Farm Carbon Toolkit position on alternative metrics for carbon footprinting.

Methane plays a crucial role in climate change, but accurately measuring its impact has long been a challenge. The most commonly used metric for measuring its impact is GWP100, which calculates its warming effect over a 100-year period. However, GWP100 does not fully reflect the gas’s short-lived nature in the atmosphere, potentially misrepresenting its impact compared to other greenhouse gases.

As a result, an alternative approach, known as GWP*, has been developed to address the challenges of measuring methane using GWP100, while offering a more dynamic picture of the gas’s real-time warming impact. At Farm Carbon Toolkit, we recognise the growing discussion around methane reporting and the potential benefits – as well as limitations – of using GWP*. This article explores the differences between GWP100 and GWP*, their implications for farmers, and how GWP* could be responsibly integrated into emissions reporting.

What is Global Warming Potential and How is it Measured?

Global Warming Potential is a measure used to compare the impact of different greenhouse gases on atmospheric warming over a specific period, relative to carbon dioxide. Since each greenhouse gas varies in how much heat it traps and how long it remains in the atmosphere, Global Warming Potential provides a standardised way to assess their contribution to climate change.

Carbon dioxide is used as the baseline because it is the most abundant greenhouse gas. GWP100 is the most widely used version of the Global Warming Potential metric, measuring the average warming potential of a gas over 100 years. This approach is the international standard used in greenhouse gas reporting, including in the Intergovernmental Panel on Climate Change (IPCC) guidelines.

Carbon dioxide remains in the atmosphere for the longest – up to a thousand years – but has the smallest warming impact of greenhouse gases and a GWP100 score of 1. However, as it is the most abundant and long-lasting GHG, this does not diminish its warming impact. In comparison, other greenhouse gases, such as methane and nitrous oxide, have significantly higher warming effects over shorter timeframes. The GWP100 for nitrous oxide is 265, meaning that one tonne of nitrous oxide causes the same amount of warming as 265 tonnes of carbon dioxide over a 100-year period. This is calculated with consideration for nitrous oxide’s 100-150 year lifespan.

GWP100 Limitations

While GWP100 is a useful tool for measuring the impact of different greenhouse gases, it has limitations. For gases like nitrous oxide and carbon dioxide, which persist in the atmosphere for hundreds or thousands of years respectively, GWP100 works well, providing an accurate comparison of their long-term warming effects. However, for methane – a potent greenhouse gas that remains in the atmosphere for only about 12 years – GWP100 fails to capture its true impact on climate change. Methane’s potency is not fully reflected when assessed over a 100-year period. While it persists for a short time, it traps heat much more effectively than carbon dioxide, significantly contributing to warming during that period.

As the science of climate change and greenhouse gas emissions evolves, it’s clear that alternative metrics will be necessary to provide a more accurate picture of methane’s role in climate change and to guide effective mitigation strategies.

GWP*: A New – but Incomplete – Approach

One such alternative metric is GWP*, which has been developed to better reflect methane’s global warming impact. Unlike standard GWP100, which assumes that emissions remain constant over time, GWP* accounts for methane’s faster breakdown in the atmosphere. As a result, GWP* can provide a clearer picture of how changes in methane emissions affect the climate in real-time, rather than assuming the gas has the same long-term impact as carbon dioxide.

Given the limitations of GWP100 in accurately reflecting methane’s warming impact, it may seem logical to switch entirely to GWP*. However, GWP* cannot be used to create a carbon footprint on its own.

One of the main reasons for this is that GWP* is not yet an internationally recognised reporting metric. While it is gaining traction in climate science discussions, it has not been formally adopted by key regulatory bodies such as the IPCC.

A further challenge of using GWP* alone is that it can cause confusion for emissions reduction efforts, especially at the farm level. GWP* measures the relative change in methane emissions over time, rather than just the total emissions. This means that small, natural variations in factors like herd size or crop activity can cause large fluctuations in carbon footprints from one year to the next. For example, a change in management practices can result in higher methane emissions, causing a spike in the carbon footprint. Conversely, a reduction in emissions, for example, from improving the efficiency of livestock production, has a greater immediate impact on reducing a farm’s reported warming contribution. These fluctuations can make emissions appear inconsistent, even if the farm’s overall environmental impact is improving. The danger is that such variability can make it harder to track long-term progress and could undermine efforts to reduce emissions.

Because of this, GWP* is most effective when applied over longer timescales and at larger scales, such as national-level carbon accounting over several decades. At this level, GWP* helps provide a more accurate picture of methane’s true warming potential, without the misleading volatility that occurs when used for annual farm-level reporting. 

For these reasons, while GWP* offers important insights into methane’s role in climate change, it should be used alongside existing GWP100 calculations rather than replacing them entirely. Employing GWP* in a way that accounts for long-term trends, rather than short-term variability, ensures that methane’s impact is assessed more accurately while still maintaining consistency in emissions reporting.

How Could GWP* be Applied to Farms?

In theory, GWP* could be used alongside GWP100 to provide a more accurate representation of a farm’s long-term methane emissions. However, applying GWP* in a practical and reliable way would require specific data and methodologies that are still under development.

To integrate GWP* into farm-level carbon footprinting, methane emissions would first need to be separated from other greenhouse gases in the emissions inventory and treated differently. Unlike GWP100, which applies a single factor to all emissions, GWP* relies on understanding the historical emissions data of methane — typically covering at least 20 years. This historical data is essential because GWP* calculates methane’s impact based on its rate of change over time, rather than treating all emissions as having an equal long-term effect. 

For an annual carbon report, the current year’s methane emissions would be adjusted based on the historical trend in emissions and a GWP* constant that scales the calculation to methane’s lifespan. However, this GWP* constant is still under development, with debates over the extent to which methane should be scaled, and, as such, has not yet been universally accepted. Once adjusted, the GWP* methane value would then be multiplied by the GWP100 emissions factor to integrate it into the overall farm footprint.

Essentially, this approach modifies a farm’s yearly methane emissions based on historical trends, scaling them to better reflect methane’s atmospheric lifespan before incorporating them into a GWP100-based report. While this suggests that GWP* could theoretically be applied in annual farm reports, it requires two critical components: comprehensive legacy data on methane emissions and an agreed-upon GWP calculation constant – both of which are still being refined by climate scientists.

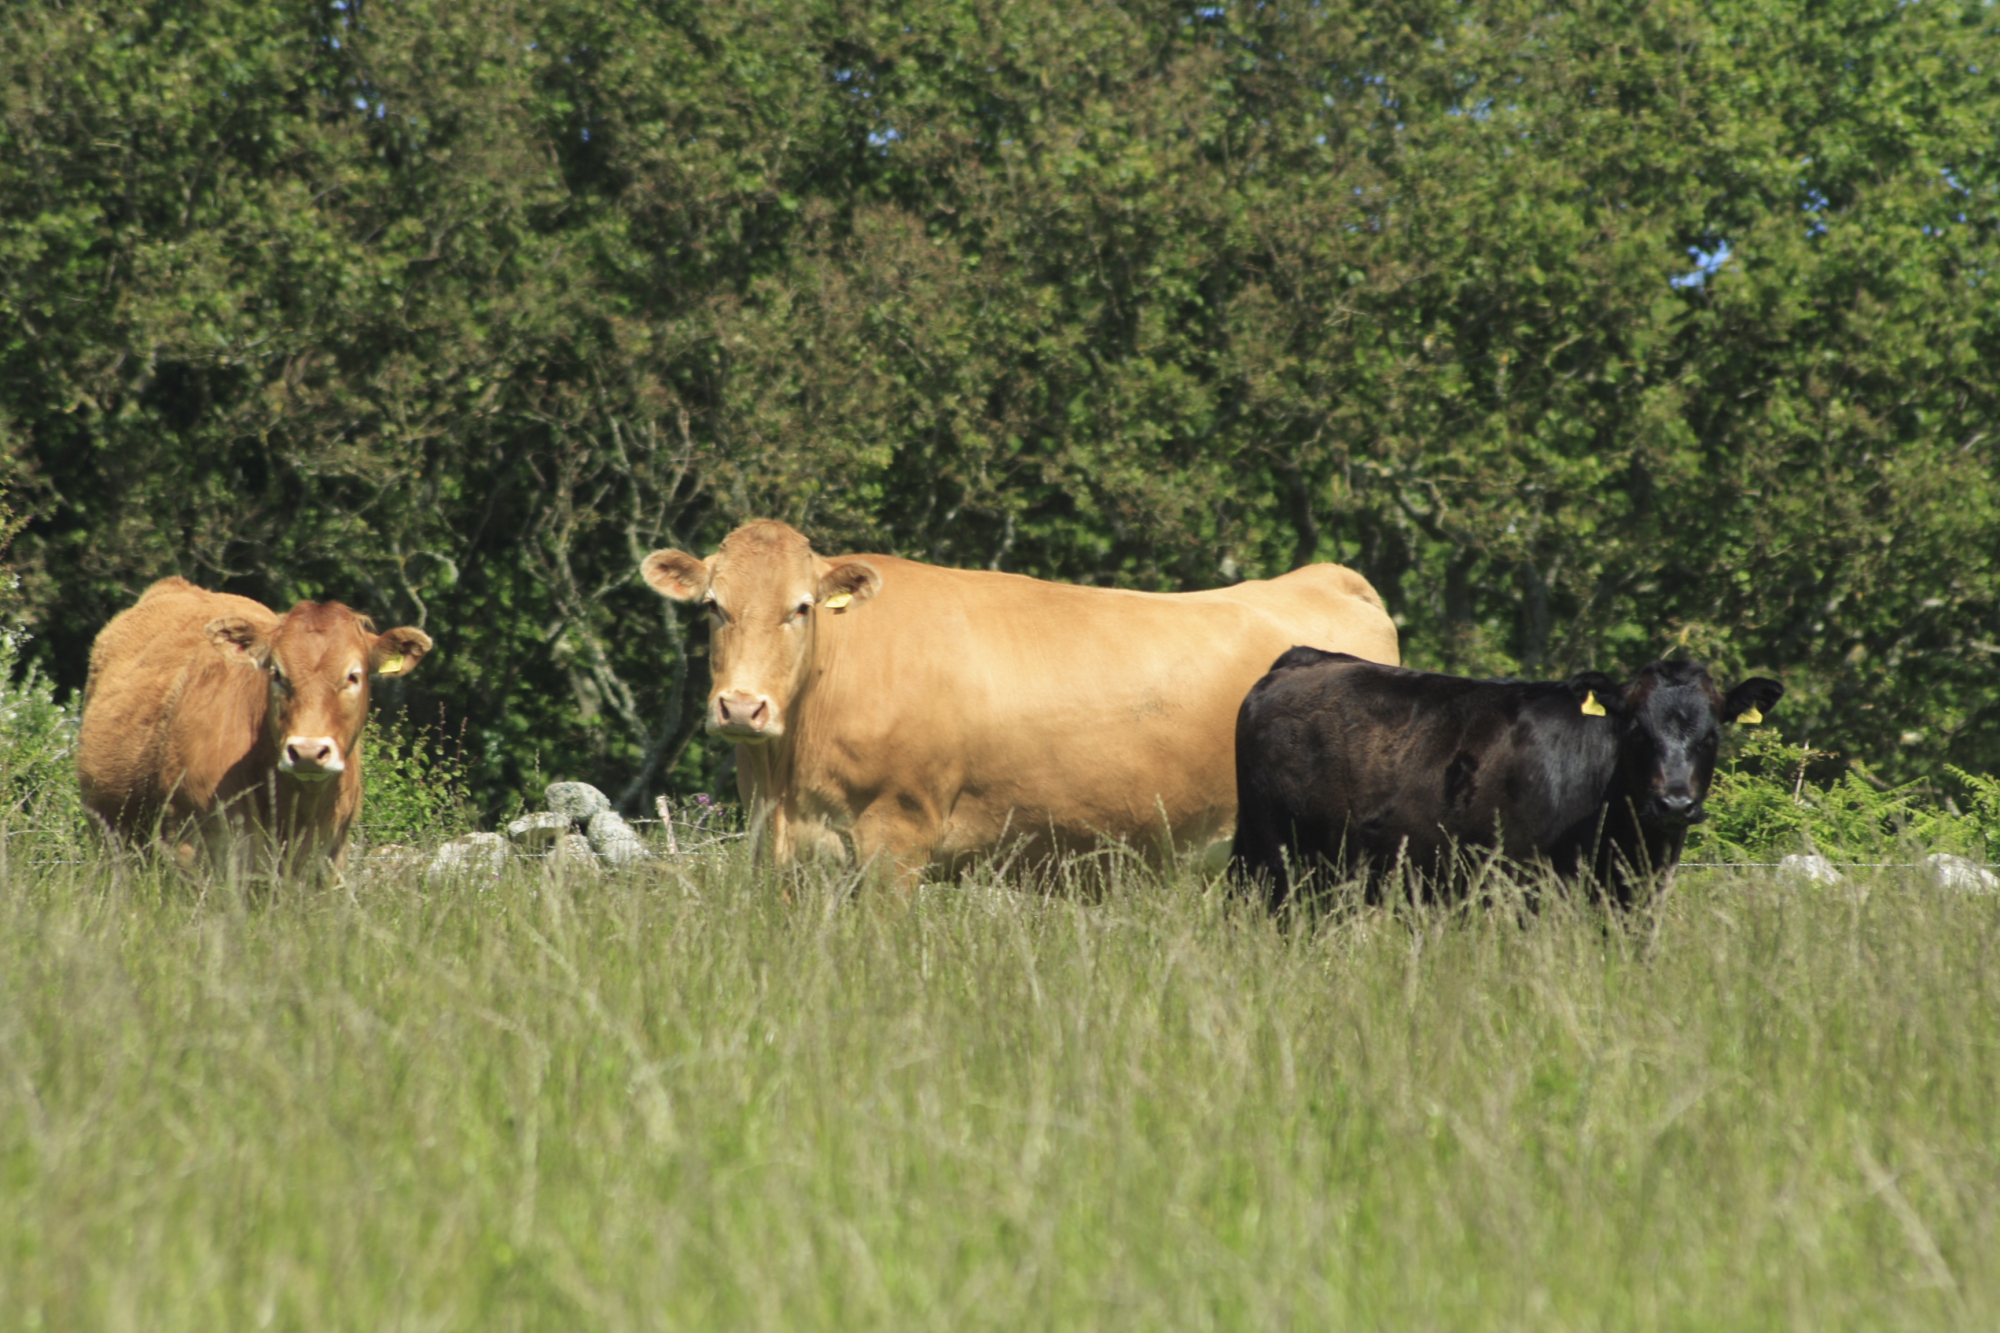
The use of GWP* will show the most dramatic impact on the carbon footprint of extensive ruminant livestock farmers, where a high proportion of their emissions come from enteric methane emissions. Currently, for these types of systems, under the current footprint methodology, there remain limited management options for mitigation of emissions other than reducing stock numbers.

Until these foundational elements are fully developed and standardised, GWP* cannot yet be seamlessly implemented into farm carbon footprinting. However, as research continues and reporting frameworks evolve, there may be future opportunities for farms to integrate GWP* into their emissions assessments in a way that balances accuracy with practical usability.

Distinguishing Between Methane Sources

While GWP* offers a more nuanced way to assess the impact of short-lived greenhouse gases like methane, it is equally important to differentiate between biogenic and anthropogenic methane sources when applying this metric.

Biogenic methane – produced naturally through biological processes such as enteric fermentation in livestock, wetlands, and peatlands – should be adjusted using GWP*. This is because biogenic methane is broken down in the atmosphere at roughly the same rate that it is produced, meaning that when emissions remain stable, there is no net increase in atmospheric methane levels. This natural balance is an essential factor in ensuring that methane’s impact is not overstated when using GWP100.

Anthropogenic methane, on the other hand, originates from human activities such as fossil fuel extraction, waste management, and slurry management. Unlike stable biogenic methane sources, anthropogenic sources add to the atmospheric methane stockpile, meaning these emissions accumulate over time rather than cycling naturally. Because of this, applying a GWP* adjustment to anthropogenic methane could underestimate its long-term climate impact, as it does not break down at the same rate that it is emitted. 

Another key consideration is that as anthropogenic methane breaks down, it eventually converts into carbon dioxide, contributing to the long-term stockpile in the atmosphere. Since carbon dioxide persists for thousands of years, this means that anthropogenic methane has a dual impact – it plays a role in short-term warming as methane and then adds to long-term warming through its carbon dioxide byproduct.

These distinctions raise important questions about how GWP* should be applied. Should emissions from degraded peat bogs or residue burning be classified as natural or human-driven? Should increasing herd sizes in agriculture be considered an anthropogenic influence? The way these questions are answered will determine which methane emissions qualify for GWP* adjustments and which should be assessed using traditional GWP100 methods.

To ensure accurate and fair carbon footprint assessments, clear guidelines on how to apply GWP* in different contexts are essential. As the science behind methane accounting evolves, so too must the frameworks that determine when and how GWP* is used in emissions reporting.

Looking Ahead: The Role of GWP* in Farm Carbon Reporting

The debate around GWP* reflects its potential to improve how we account for methane emissions, particularly for livestock systems that feel misrepresented by GWP100. While it offers a more realistic view of methane’s short-term climate impact, its sensitivity to year-on-year changes can create volatility in farm-level reporting and complicate efforts to track progress reliably.

There is also a risk that GWP* could be misused, allowing businesses to claim emissions reductions without making genuine changes, or pressuring farmers into quick fixes like reducing herd sizes. To avoid these outcomes, any use of GWP* must be transparent, grounded in science, and applied fairly across all sectors. Done well, it could become a valuable tool – alongside GWP100 – for building a more accurate and trusted approach to agricultural carbon footprinting.

At Farm Carbon Toolkit, we remain committed to exploring how GWP* can be integrated responsibly into emissions reporting, ensuring that any changes reflect both scientific accuracy and practical fairness for farmers. We are exploring how GWP* can be appropriately implemented alongside the current GWP100 reports as part of a dual reporting system. With this in mind, we recommend continuing to produce reports using GWP100 now, as these will provide a valuable baseline to support dual reporting in the future. Given the significant impact of timespan on GWP* data, we are considering solutions based on multi-year reporting to improve accuracy and consistency. 

As research progresses and reporting frameworks evolve, clear guidance and safeguards will be essential in ensuring GWP* supports effective, fair and transparent carbon reporting across the farming sector.


Craig Blyth-Moore is a sustainability communications professional with over a decade of experience turning complex environmental issues into clear, compelling narratives. He has written extensively on energy efficiency, renewable energy, the energy transition and sustainable logistics, helping organisations communicate their sustainability strategies with credibility and impact. 

Craig holds an MSc in Environmental Sustainability and brings both subject matter expertise and strategic insight to his work. His writing has appeared on leading global platforms including Economist Impact and the World Economic Forum, helping to inform and inspire meaningful climate action.

Oxton Organics – pushing the boundaries of soil health

Had we still been ploughing now, we would’ve had two or three terrible seasons and lots of soil damage. The way I farm now has softened that blow. I wouldn’t want to be cultivating the land like we used to.” 

Jayne Arnold is a grower who is really pushing the boundaries of soil health and management. Based on a 12-acre organic vegetable farm in Worcestershire, she is constantly striving to find ways to improve the diversity, depth, quality and carbon content of their soils. Growing for their own veg box scheme, the farm also has a few sheep, an orchard, agroforestry and makes plenty of compost.

In this new Case Study, we learn how Oxton Organics is balancing a productive farm, producing local food, whilst constantly improving soil health and quality through a voracious appetite for knowledge and an approach.

Click here to download this case study as a PDF.

Drilling green manures between salad crops

Whilst the farm has been organic for a long time, it’s only in the last 7-8 years that this new approach to soil management started, producing some really impressive results. The approach is underpinned by applying high quality compost, biostimulants, and covering the soil as much as possible through mulches, compost and green manures.

The sheep play an important role, and the pastures they’re on have improved significantly since the species mix and stocking regime has changed. This has resulted in not just better pastures and better soil helath, but much more biodiversity too, as Jayne notes:

In the years after sowing the pasture, it was predominantly grasses, white clover, and yarrow, with a little ribwort, burnet and yellow trefoil. Now there is much more diversity, there are flowers throughout summer and autumn, including dandelions, wild carrot, yarrow, knapweed, oxeye daisy and much more. A few bee orchids and pyramidal orchid appeared four years ago and returned every year since. We had never seen orchids on the farm before! Butterflies and other pollinating insects are also more abundant.”

Biodiverse pastures at Oxton Organics

Wildlife abounds above and below ground, from the tall hedges and lines of willow coppice to the flowers of the pastures and the cropland soil teeming with life. “There are so many worms in the soil, it’s hard to avoid them when transplanting crops!” Jayne says.

Soil Organic Matter levels are rising and distributed more evenly through the soil profile. Structure is improving, soil colouration is more even and deeper through the profile. The action of worms and perennial plants helps to draw carbon down in the soil profile – and that means it is also more stable. Carbon sequestered into the soil like this is a proper drawdown of atmospheric carbon; if it’s not released then it is stable and locked away.

An example of a deep rooting and diverse green manure mix, in one of the polytunnels

Jayne notes that weather patterns have changed, with more frequent extreme rainfall events. “The up and downness of the weather has changed a lot, she says. Building resilience in the stability of farm soils is essential in helping to mitigate such risks that all growers are experiencing from a changing climate. Soils that are higher in carbon, have a mulch or living cover, and have better structure will be much more resilient to the effects of both heavy rain and drought.

The farm’s focus on soil management underpins all the positive aspects outputs of the farm – quality food, flood resilience, carbon sequestration, biodiversity, and indeed sheer enjoyment and intrigue that gets growers out of bed in the morning. A refreshing look at green manures, founded on experience and observation, demonstrates one example of this: “you won’t build a fungal dominant soil with legumes. Plants will reject mycorrhizal associations if there’s too much Nitrogen in the system. You need to build bacteria that naturally fix Nitrogen and be more balanced. You don’t see many legumes in the hedgerow – yet that’s all green” says Jayne. 

Mycorrhizal fungi associating with a radish

Managing carbon is also part of the business strategy, using an electric van for deliveries, minimising any cultivations, ensuring lots of carbon sequestration, and reducing inputs. With so much carbon being absorbed on the farm and being turned into soil organic matter, the farm is really demonstrating how to grow in a way that builds capital for the future, whilst producing great quality food and continuing to explore and push the boundaries.

Sheep grazing in the pastures at Oxton Organics

With thanks to Jayne Arnold for the photos and the interview. Written by Jonathan Smith.

https://www.oxtonorganics.co.uk

Supporting Innovation in Soil Health: Our Collaboration with LandApp

At the Farm Carbon Toolkit, we’re excited to share news about our recent collaboration with Land App to support the development and launch of their new Soil Survey feature on Land App Mobile.

As part of the Agri-Carbon Kernow project in Cornwall, our team played a role in helping develop and test this tool, which is designed to help farmers and land managers record, report, and review both lab and in-field soil measurements. 

A Collaborative Effort

Working closely with the Land App team, we brought together our expertise in soil health and carbon to create a digital soil sampling solution that meets real-world needs. 

By integrating the robust soil survey methodologies we advocate in our projects into Land App’s platform, we’ve enabled farmers to gain deeper insights into soil health and carbon sequestration potential. The new feature not only helps users assess soil conditions with greater accuracy but also supports more informed decision-making for sustainable land management, as well as the evidence required for the Sustainable Farming Incentive (SFI).

The new Soil Survey feature enhances Land App Mobile’s suite of data collection tools—joining the General Data Collection survey and PTES’ Healthy Hedgerows—to provide reliable insights into soil health, which are essential for informed land management and funding applications.

Why It Matters

  • Digital Efficiency: Easily record and review soil sample data on the go, including the ability to support evidence required for SFI.
  • Sustainable Impact: Empowering better land management decisions through accurate, real-time data.
  • Collaborative Innovation: A tangible outcome of our work in the Agri-Carbon Kernow project, highlighting the benefits of cross-sector collaboration.

We’re proud to have supported Land App in bringing this feature to life and look forward to further innovations and collaborations. This includes using the Land App API to help users seamlessly manage their soil data within each platform.

Thank you to the team at Land App for their partnership—and for the opportunity to help shape tools that support sustainable land management!

Find out more

For further details and to see the Soil Survey feature in action, please refer to the Land App’s guidance.

Reflections on the 7th Carbon Budget from the  Climate Change Committee

Every five years, the Committee on Climate Change (CCC)1 publishes a statutory report detailing the UK’s ‘carbon budget’ for a future five-year period. The 7th Carbon Budget covers the period 2038-2042. It is a stock-take of UK GHG emissions (current and future) and provides advice to the Government on how and where these emissions will need to be reduced (‘the pathway’) if the UK is to meet its legal obligations to reduce emissions to net zero by 2050. 

This report came out with other reports and consultations such as the Defra Land Use Framework Consultation and the IGD’s Net Zero Transition Plan for the UK Food System. Certainly how we produce food and look after agricultural land in the UK is coming more and more under the spotlight.

Within the 7th Carbon Budget report, it is good to see that the role of land use change in removing carbon is now being linked to agricultural land which gives a truer picture than was previously the case, when land use change was in a separate silo.

It is clear that the carbon budget is very high level, focussing on climate impacts only, with little reference to the impacts of the proposed changes on biodiversity across the UK’s agricultural land. In reviewing this budget, FCT has taken a very practical viewpoint and has reflected on areas where the budget could have helpfully provided more detail and looked at how to fully engage with farmers and growers across the land who are on the delivery frontline.

As other sectors decarbonise, the proportion of total emissions arising from agriculture will increase, putting more pressure on the sector to make progress on emissions reduction and carbon removals. In 2022 the contribution of agriculture to overall UK emissions was 12%. By 2040 this is predicted to rise to 27%, after the activity to reduce emissions set out in the carbon budget and it will be the second highest emitter after aviation even with the target action outlined in this carbon budget.

The report proposes a pathway for agriculture to reach net zero by 2050. Not surprisingly woodland creation, peatland restoration and other land use changes are highlighted as mechanisms to sequester more carbon. There is significant reliance on carbon sequestration into land sinks through the 2040’s but little reliance on any level of carbon sequestration into soil itself. 

There is a reliance on increased tree planting from the late 2020’s onwards as trees will only start to sequester larger volumes of carbon from 15 years of age onwards. According to the UK Woodland Carbon Code, sequestration rates for woodland increase dramatically during the “teenage years” of woodland establishment. In total, woodland creation has been modelled to contribute 15% to emissions reduction by 2050 . This will require an additional 1.1 million ha of woodland to be planted by 2050. In addition some 300,000 ha of lowland peat and 970,000 ha of upland peat will be returned to natural/ rewetted condition by the same time.

For agriculture the reduction in overall GHG emissions is targeted at 45% by 2050 compared to 2022, coming primarily from a reduction in livestock numbers (38% by 2050) with a relatively small contribution from the adoption of low carbon farming practices. These reductions are significant, reducing the breeding flock of sheep from 15 to 11 million ewes and the breeding cattle herd from 3 to 2 million head.

The reduction in grazing livestock numbers will release land for tree planting. The combined effect of the changes to farming practice and tree planting is to suggest that the sector will become a net sequesterer of carbon by 2048.

There are a number of important assumptions included within this budget which bear further scrutiny:

  • Crop yields will increase by 16% by 2050. Presumably this increase is deemed necessary to ensure adequate plant based foods to replace the current levels of meat in our diets. However it is questionable whether this will be achievable in practice, even if gene editing technologies are successful and fully deployed as more adverse weather events are already affecting yield levels in the UK and across the world. It is not clear how critical to successful achievement of the overall plan this is.
  • Stocking rates for grazing livestock on lowland will increase by around 10% with stocking rates in the upland reduced. Presumably the former is to allow for more land to be released to grow crops for human consumption and the latter to reflect the current over-grazing in parts of the upland and to reflect rewetting of upland peatlands and the proposals for tree planting. Targeting increased stocking rates for lowland livestock could require additional artificial fertiliser inputs which would seem counter intuitive, though the increased stocking rate could potentially be achieved through improvements in grassland utilisation efficiency.
  • Consumption of meat products (primarily beef and lamb) will fall by 35% by 2050 compared to 2019 levels. On first sight it would appear that changes in consumption are mirroring proposed reductions in livestock numbers, however, no mention is made of any changes in dairy cow numbers, but since the majority of beef produced in the UK comes from the dairy herd this will also impact milk production. Consideration is also given to replacing meat in ready meals with plant based alternatives which will negatively affect carcass balance, with lower value “cuts” often used for this purpose at the moment. This would put further pressure on sector profitability. The targeted reduction in ruminant livestock numbers would lead to a lower requirement of permanent grassland for grazing of a similar order to the reduction in livestock numbers. This would amount to around 3 million ha which could be diverted for other use, where this is possible. Tree planting would be a key use for poorer quality ground (topography and stoniness) with better quality grassland moving to arable cropping where this is possible. This would probably lead to loss of carbon from soils, especially when permanent grassland is first transitioned to arable cropping2. It is not clear whether this has been accounted for within the overall budget. 
  • The carbon budget includes a very low value (0.5Mt CO2e per year for carbon removed by grassland soils). This appears to be low and seems to take little account of the ability for well-managed livestock systems to bring multiple benefits beyond reducing emissions including carbon removals into soils and enhanced biodiversity.

    More research and data analysis is required urgently to inform us of the ability of the soil to permanently and reliably store more carbon and how best this can be done. We have some information as do others, but as yet this is not a body of evidence which the CCC can use as part of its carbon budget.
  • Returning around 300,000 ha lowland peat to a rewetted state will impinge upon its current use for growing vegetables, fruit and arable crops. The report does mention that some 10% of horticultural production will move indoors, which is likely to focus on leafy salad type crops. However for field scale vegetable production left to be grown outdoors the question remains as to where they will be grown. Moving vegetable growing to other parts of the UK will require careful site selection if current levels of margin (currently pretty low) are to be maintained and consideration of the infrastructure required, such as pack houses and cold stores.

There were also a number of notable omissions from the budget:

  • Whilst the pathway to reduce nitrous oxide emissions are recognised as coming primarily from agriculture, there is no mention of the need to reduce reliance on fossil fuel based N fertilisers. For arable cropping, up to 75% of total emissions arise from the production and use of artificial N fertiliser. Great work is being done to produce low carbon alternatives, but further information on the likely “winning technologies” in this space would have been helpful.
  • The level of efficiency of the UK to produce food at a lower GHG intensity than some other nations, utilising fewer arable resources (land and feed) and with lower supply chain discards through a circular feed system provides the nation with a competitive advantage in terms of overall emissions per unit of home grown food. This could be better recognised within the budget report.
  • There is no mention of any target to reduce numbers of pigs and poultry within this 7th Carbon Budget. Whilst the animals themselves do not emit methane, their manures do and their reliance on imported soya has a significant impact on overall UK agriculture emissions as well as the soil degradation associated with cereal production to grow the cereals they wholly rely on. We have estimated that reducing reliance on imported soya by 50% and moving to feeding UK grown beans and pulses will reduce the emissions from agriculture by 7% (primarily due to reduced reliance on artificial N fertiliser and to removing deforestation emissions on 50% soya supply).

Reliance on land use change to enable agriculture to reach net zero by 2050

In the period from 2043-2050 agriculture and land use are budgeted to contribute the largest share of net emissions reduction (35%) – see figure 2 below from the Carbon Budget report, and to reach net zero emissions by 2050 as a result of increases in carbon sequestration into land sinks (primarily increased areas of woodland and reduced emissions from peatland due to changed management) with emissions of around 25Mt CO2e and sequestration of around 26Mt CO2e per year. Current emissions from UK agriculture are around 48Mt CO2e per year.

Distribution of emissions reductions during each carbon budget period (Climate Change Committee, Seventh Carbon Budget, 2025)

At FCT, we are in agreement with the Agriculture Advisory Group of the UK Climate Change Committee and its report in calling for more nuanced targets which better reflect the benefits of UK livestock production, especially when it is primarily based on the consumption of forages. We also agree with their view that it is important to reflect on the impact of the different gases on warming aligned to the Paris Agreement temperature goal. Both GWP100 and GWP* metrics are important and could already be reported in concert to inform on both GHG accounting (CO2e) for national inventories and impact of different GHGs on climate warming (CO2e) important for the Paris Agreement. 

We believe that the report could be much more positive about the contribution that resilient farming businesses, agricultural land and farmers can make to meeting the climate change challenge. Positive engagement and empowerment of farmers, growers and land managers are critical elements in building confidence and encouraging investment but is currently patchy, with beacons of good practice such as the Farm Net Zero project in Cornwall, which is delivering change on the ground and practically supporting farm businesses to transition towards net zero.

Footnotes

  1. A body set up to hold the government to account on their progress towards net zero and reducing emissions
  2. The UK GHG inventory suggests that the average change in non- organic soil carbon density (to 1M deep) from converting grassland to cropland in England is -24 tonnes C/ ha, in Scotland is -101 tC/ha, Wales -39 tC/ha and NI -68 tC/ha

Reducing greenhouse gas emissions from grassland

The key areas of grassland management that are known to significantly reduce greenhouse gas emissions are fertiliser application and management of applications, grazing management, introduction of more diverse species into grassland including legumes and herbs, and correct use and application of farmyard manures and slurries

Effective, efficient use of artificial N fertilisers

Greenhouse gas emissions from synthetic fertilisers is a significant emissions source on grassland farms. 50% of emissions come from the production of the synthetic fertilisers and about 50% from the processes that take place in the soil after application. Estimates suggest that 10-30% of all applied nitrogen fertiliser is lost to the crop or grassland to which it is applied; use efficiency is influenced by application method and environmental conditions at the time of spreading. Make sure soil pH is above 6.5 if possible, soils are not compacted, that soil temperature is warm and rising and that soils are not not waterlogged. Do the basics well and you will get better yield response from your fertilisers and lower GHG emissions.

Reliance on Inorganic N fertiliser usage can be reduced through incorporating more legumes into swards. Establishing clover within temporary leys has additional benefits of higher protein forage and also a more diverse rooting system which can aid production in adverse climatic conditions. Typically grass clover swards containing around 30% clover by DM can fix around 120Kg – 180 Kg N /ha/ year. When they are in the sward, this is free nitrogen fertiliser!

As we are coming to appreciate that the nitrous oxide emissions associated with inorganic N fertilisers are a huge part of agriculture’s total emissions, improving N fertiliser use efficiency is critical.  Saving 170kg N/ ha across 50ha will reduce emissions  by around 58 tonnes CO2e which is more carbon than is sequestered annually in 10ha of broadleaf woodland.

Grazing Management

Grazing rotation is an excellent way to increase grass utilisation and reduce GHG emissions. Ensure there are adequate rest periods between grazing cycles to allow the sward to recover to optimise soil and plant health. Consider sub-dividing fields further to  allow for more regular livestock  movement. The long term effect of increasing rest periods and grazing taller grass is improved soil organic matter and soil structure. This will aid in reducing weed burden, lengthen the grazing season and improve resilience to flood and drought.

Including deeper rooting and more traditional species will increase above and below-ground biodiversity which may increase productivity alongside potential carbon capture and sequestration deeper into the soil profile. Ensure that grassland species composition supports production goals, soil type, soil pH and climatic conditions and consider overseeding where required. 

Overseeding permanent pasture with improved diversity can provide a wide array of benefits.  If 5 ha permanent pasture was over-seeded or re-seeded to create a herbal ley (consistent with SAM3 SFI) it could provide an additional -15.68 t CO2e of carbon removed per year. This will also build soil health and resilience by optimising the above ground canopy increasing the surface area of leaves for photosynthesis and supporting a greater below ground biodiversity responsible for cycling nutrients.

Accurate consideration of manures and slurries

Sampling and analysis of your farmyard manures and slurries will enable optimal accounting for the nutrients in them. Knowing what you are applying will enhance the accuracy of nutrient management planning and could reduce the requirement for synthetic N fertiliser. Consider the application method when applying organic manures to avoid nutrient losses and if possible cover muck heaps like silage heaps where possible to avoid dilution and runoff of nutrients. 

Cornish farm cuts artificial fertiliser use by 60%

At Tregooden Farm in Cornwall, farmers Malcolm and Catherine Barrett are pioneering ways to take their farm to net zero carbon and beyond. With a 150 strong beef herd on 300 acres, the couple have transformed the way they farm by focussing on soil health, biodiversity and animal health.

Catherine and Malcolm Barrett

On this Duchy of Conrwall farm, the livestock graze on the pastures, but are also fed on maize. The maize is being farmed in a very different way to how they used to work in an intensive dairy system. Across the farm, the huge drop in artifical fertiliser use (by 60% over 4 years) has had significant cost and carbon benefits. Malcolm said:

 “We went quicker than we might have done, but it seems to have worked. No yield deficits are showing yet! I want to move to a point where we’re not applying artificial fertiliser, relying on biological foliar feeds.” 

By adding green waste compost and manure at rates of just a few tonnes per acre, they concentrate on feeding the soil biology to stimulate improved soil health and carbon sequestration. As Malcolm says “We’re farming livestock both above ground and below”.

Maize growing at Tregooden under the low fertiliser approach

Fuel use has fallen to just nine litres per hectare, due to the cultivations changing to a system based on discing and a direct drill. “We used to beat the living daylight out the soil – there’s no need to do that now” says Malcolm. In addition, he realises the changes are spreading through the community: “Our son is 20 and works for a local contractor. Last spring he asked  – ‘why do they work the fields so much?’ It was a lightbulb moment!

Grazing has changed substantially by grazing more instensively over shorter periods. There are 80 acres of green manures including Westerwolds, rape, stubble turnips, black oats, crimson clover, winter vetch, beans, designed by FCT’s Hannah Jones.

Green manure mix on the farm

Biodiveristy is improving below ground, with good dung beetle and earthworm activity obvious, and soil sampling showing that Soil Organic Matter is rising across the farm – which means carbon is being sequestered. Above ground tree planting, hedge management, wetlands and improved pastures have led to noticeable improvements in bird and insect populations.

Wetland, and mature trees – great for biodiversity and sequestering carbon.

The Barretts are enjoying showing people around the farm, and are invlovled with Farm Net Zero, Innovative Farmers and the Duchy of Cornwall. They want to inspire change in others – farmers, agronomists, community, researchers and more.

Looking forward, Malcolm said “I’m excited about the future, we’re working with soil and nature again.”

It’s clear this farm is a really embracing the change towards net zero, and coming up with an innovative approach to farming. The farm and farmers are demonstrating tangible environmental and social improvements, an inspiration to others.

See more

Watch a video by Catherine of the farm https://www.youtube.com/watch?v=CR-2mdhnqZE

Read the full case study here on FCT’s website https://farmcarbontoolkit.org.uk/toolkit/case-studies/

Grassland Manager of the Year 2025

Andrew and Clare Brewer: 2025 winners in the National Arable and Grassland Awards 

Andrew Brewer is our FCT Carbon Farmer of the Year 2024 and we are delighted to congratulate him and Clare on scooping the National Arable and Grassland award for Grassland Manager of the year. Andrew is also one of our Demonstration Farms in the Farm Net Zero Project in Cornwall which is supported by the National Lottery.

Andrew and Clare are pictured in the centre of the photo with sponsors and judges

They were worthy winners in this category. The Awards are supported by a wide range of industry businesses including BASIS and the National Association of Agricultural Contractors.  

A day in the life of… Joseph Jones, Farm Carbon and Soils Project Assistant

My name is Joe and I work at FCT as the Farm Carbon and Soils Project Assistant. I’m coming up to the completion of my first 12 months at the organisation and so it feels like a good time to reflect on what has been an exciting journey so far and what my day-day consists of. 

Beginning 

In my early days at FCT, I felt very welcomed by the team but I knew I had a challenge as I had to get to grips with many aspects of farming which I was not familiar with, coming from a non-agricultural background. I was very lucky to be able to shadow and observe different members of our knowledgeable advisor team during farm visits and soil sampling trips around Cornwall, Devon and Somerset. Although I learned many valuable things, the two most important lessons I took away were the importance of different people working together to solve the challenges that we are facing as a country, and that sometimes it’s more important to just listen to what someone wants to say than to have to say something back. 

After my initial training period, I began to conduct my own farm visits, learning more about the variety of farming systems and the people at the heart of those systems, and what their visions and worries were looking into the future. From these visits I would use our great Calculator to look through the carbon lens and see what was happening on these farms and see where the farms could get more efficient but also closer to net zero. In writing the reports and handing them back I got to see what information would be most interesting to the farmers and hopefully useful to their farm’s management decisions. Now, when I look back, I can see how much I’ve learnt, but I also know that what is left to know is endless. I think I have come to accept that, which is very liberating too.

Day to Day

My day to day is very variable, but I can summarise some key activities and projects that I work on for FCT. The main one is the incredible Connecting Constable & Gainsborough Country, one of the largest Landscape Recovery projects in England. It is a collaboration between two farm clusters in Suffolk and Essex and the Suffolk Wildlife Trust. Most of my time is spent conducting farm visits, understanding the farmer’s system and motivations, processing the data , and then writing the reports and handing them back to the farms involved. 

Another exciting but more hands on project I assist with is the England Ecosystem Survey (EES). The largest survey ever conducted in the UK, me and my colleague Jemma have visited some beautiful sites in the West Country to collect soils following the detailed protocol set by Natural England. Once the data has been gathered and analysed we will have the most comprehensive set of soil dataset covering England.  Lastly, the final project I am involved with is CHCx3. This is an exciting collaboration between agricultural and industrial partners to develop and explore more diverse crop options for greater carbon sequestration and reduced GHG emissions. FCT is supporting the project with its soil sampling aspect, co-ordinating with our project partners to examine soil carbon patterns underneath these crops and footprint the farms involved. 

Outside of these core activities, I get to participate with some of the great events we put on, including Soil Farmer of the Year, Carbon Farmer of the Year, our Field Days and our staff Away Days, all of which are fun and interesting. 

Exciting Future

Although there seems to be constant news stories about setbacks in environmental and human health, in the projects I work on for FCT I do feel like I can see the positive changes beginning to take shape more and more. There is a growing demand for a healthier lifestyle and the systems that support it as well as a more harmonious relationship with our environment and the creatures in it. One of the most satisfying aspects of my role, alongside the skills and experiences, is the fact that, in my small way, I hope I am playing my part in supporting this change. I feel very lucky to have that opportunity. 

A day in the life of… Grace Wardell, Calculator Development Officer

I’m Grace, one of FCT’s Calculator Development Officers. If you haven’t heard of FCT or our Farm Carbon Calculator, that job title probably means very little to you! So, let me explain what I do on a day to day basis to help maintain running one of the UK’s top 3 farm carbon calculators.

The Farm Carbon Calculator is just one branch of FCT’s work and is a tool within our online toolkit. Working within our Calculator team, my role is to ensure the Farm Carbon Calculator is based on rigorous science, remains up-to-date with standards and guidance, and is free of bugs that can sometimes appear when running a software.

To achieve these aims, I am regularly undertaking research, particularly if someone has requested an item on the Calculator, like a specific fertiliser or crop. I will find associated emissions factors, consult with experts in the field, alongside standards and guidance to ensure we are employing the recommended calculations.

Each year we undertake two major updates, one in April where we assess and update all emissions factors and one in October where we also look to improve the functionality of the Calculator. These are busy times for our team, where we work through and update thousands of line items on the Calculator to ensure we remain up-to-date with the latest science and data that’s available. All the while, I work alongside Lizzy Parker (Calculator Manager), James Pitman (Calculator Development Officer) and our software developers to keep the website running smoothly. 


Aside from my core work on the Calculator, one of the exciting things about working for FCT is the breadth of interesting projects we are involved in. I have undertaken farm modelling work for a few different projects looking to model the transition to more regenerative practices and the impacts that may have on greenhouse gas emissions. I regularly go to farming conferences to hear firsthand the issues that farmers are facing and can offer free advice on carbon footprinting their farm. I get to brush up on my science communication skills when posting blogs on our website on hot topics. I also get to enjoy our in person events such as our Annual Field Day, Soil Farmer of the Year and Carbon Farmer of the Year events, where we champion pioneers in sustainable farming.

Since we all work remotely and are spread far and wide across the UK, it is these in-person events and our Away Days that remind me how lucky I am to work with such passionate people who care immensely about our farmers, our environment and our food production systems.

A day in the life of… Calum Adams, Calculator Data Assistant

I’m Calum, the Calculator Data Assistant for the Farm Carbon Toolkit (FCT). I can imagine if you don’t work for FCT, you may not know who I am. I tend to work in the background, assisting the passionate and driven people who do great work in helping farmers to meet their low carbon and sustainability goals.


Day to day, my activities and tasks can vary widely, depending on the needs of the Calculator team as well as Izzy, our Data Scientist with whom I also work closely.

I primarily work with the Calculator team which can involve a variety of tasks. One of my main responsibilities is the rigorous testing of the Calculator after every update, and following the addition of new items to the calculator. Flagging errors and helping to resolve issues (if indeed there are any!) ensures a reliable tool and the efficient running of the calculator that farmers and landowners can use seamlessly. Another major part of my role is information-finding. Regularly, the Calculator team receives requests for additional products/items/data entries to be added to the calculator. Personally, I was surprised by how many crop protection products (insecticides/herbicides etc.) that are available to farmers, upwards of 30,000 different products available in the UK alone. So you can imagine, with changing trends and needs of farmers to protect their crops in various ways, we as a Calculator team need to keep up with adding additional products to the calculator.

Outwith helping the smooth running of the calculator, my responsibilities include assisting Izzy, our Data Scientist, with her work. Recently, I’ve been assisting her in updating and maintaining soil sampling datasets using QGIS (a spatial data software) that have been collected by the advisory team. I also assist Izzy by testing apps that she designed herself! One of which is a soil sampling app for use by the FCT Advisory team to record soil sampling points more efficiently. I’m particularly grateful for this piece of work as it takes me away from my desk and gets me walking around, albeit on the streets of Edinburgh rather than the fields.

My day to day can vary depending on the tasks that are required or whether I’m working out of my flat, a cafe or the Melting Pot, the co-working space I go to. I’m kept on my toes with the diversity of work to do. Through this type of work, it might seem easy to disassociate from the real-world challenges faced by farmers in a changing climate when you’re spending your days hidden behind a screen, focused on numbers and code. However, this is what I feel FCT does very well, in connecting us to the issues we are all helping to solve. Between the numbers and spreadsheets, we do well to have numerous meetings, whether it be online, hearing about the projects FCT are involved in such as Farm Net Zero, or in person days where we celebrate the farmers that are doing the most to demonstrate low-carbon, sustainable agriculture.

My first in-person day was last September at our annual field day, where FCT presented the Carbon Farmer of the Year. An opportunity to hear first-hand what farmers are implementing to produce our food in a sustainable and low-carbon manner with the help of our carbon calculator. I always come back from these days feeling invigorated to tackle the next challenge knowing that farmers are using the calculator to benefit their farms and the environment.