University of Cumbria is offering their part-time short course ‘Upland Farming for Net Zero’ delivered in partnership with Farm Carbon Toolkit, across 5 weeks from 9th September 2024. The course will take place in Cumbria, with sessions at the University of Cumbria’s Ambleside Campus, at upland farms across the county, and online.
Participants will learn where and how greenhouse gases are emitted, captured and stored on an upland farm. Farm visits and theory sessions will enable a comparison of farming practices and land management options, with climate impact in mind. In-person workshops will build skills and confidence to enable each participant to complete a quantitative farm carbon audit and make practical recommendations for actions towards net zero emissions.
Up to 12 full bursaries, subject to eligibility, are offered by the Foundation for Common Land via their Our Upland Commons project, with details available here.
Farm Carbon Toolkit supported the development of this accredited course for farmers, advisors and new entrants and worked with the University of Cumbria to enable delivery of the course for the first time earlier this year, in Dartmoor. Comments from participants included:
It was really worthwhile and I’ve gained a lot of knowledge and practical skills from attending
Plenty of on-farm, real-world teaching and examples
Becky was a fantastic tutor- incredibly engaging and knowledgeable
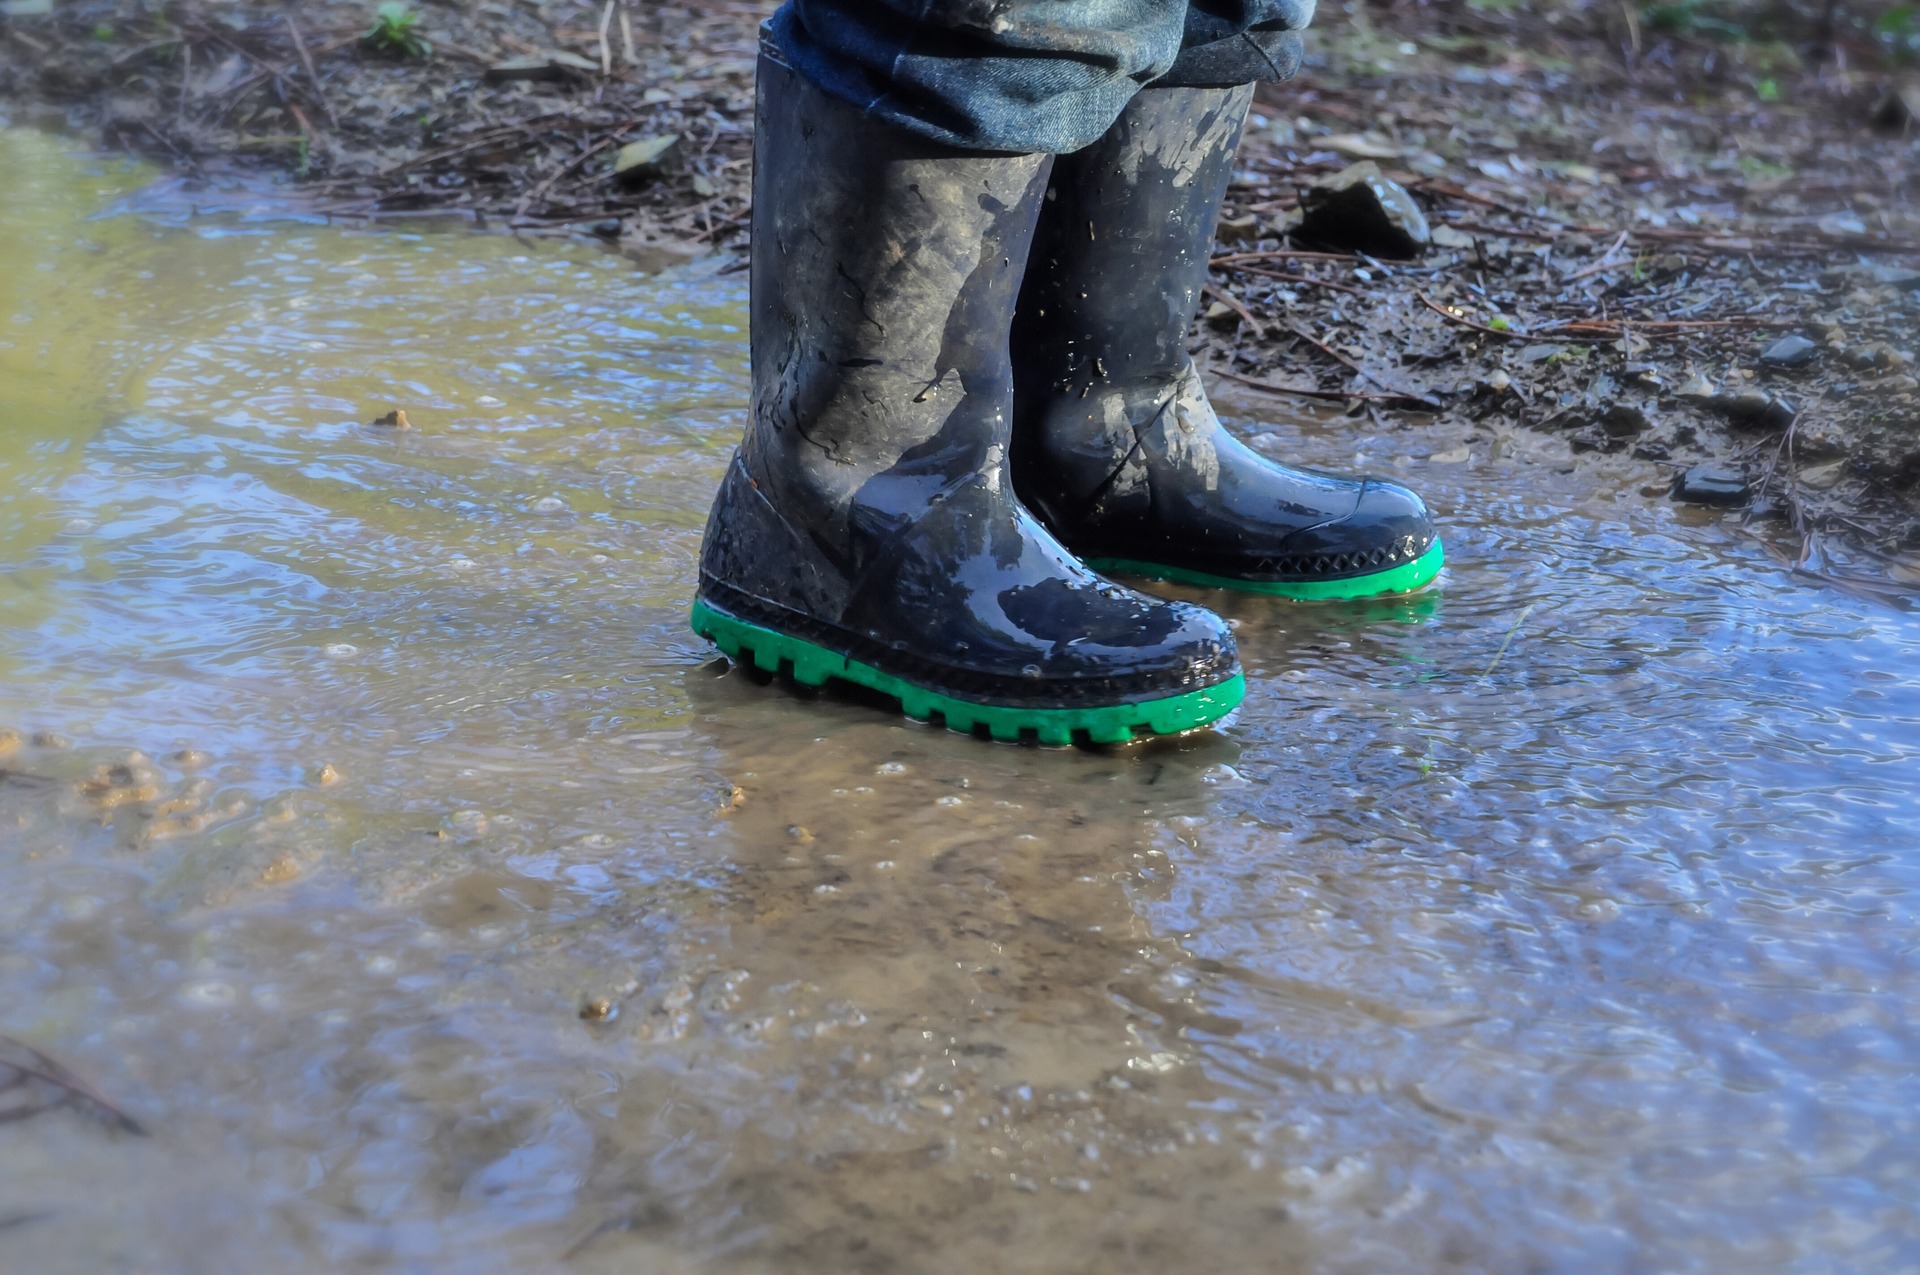
As this blog goes live, we have experienced an extraordinary weather year across the UK, and the impact on farming and growing has been profound. February and March saw record rainfall across most of the country, followed by some drier spells and then continued rain in places. The net result has been one of the most challenging springs for years, which is such a crucial time in the UK farming calendar. Late spring and early summer has been very variable, according to which part of the country you are.
Rewind to summer 2023 and June was considered to be the hottest June ever in UK weather records, followed by another hot spell in September. Yet in between, July and August were unsettled, with two major storms. Mild, stormy and wet spells were the continuing theme for the latter part of the year.
Everyone in farming and growing understands the critical effect that weather plays in the annual cycle of producing food, managing land, and the financial health of farm businesses. It is clear that weather patterns and the climate are becoming more unpredictable, creating significant impacts for farms, land and food. How do farmers and growers plan for the future with climate extremes becoming the norm?
The outlook
Met Office predictions for the trends in UK weather patterns over the next 30 years or so will include:
Warmer and wetter winters
Hotter and drier summers
More frequent and intense weather extremes
This is happening now, but the knock on impacts are sometimes harder to predict, for example:
Unpredictable weather patterns make all sorts of farming operations – from silage cutting, potato planting, arable drilling to crop harvest far more difficult to plan
Significant variations in crop and animal health due to stress factors
Uncertainty in business planning and financial returns
Cumulative impacts that compound to present challenges – such as shorter windows to plant, changing pest and disease pressures, international market changes, etc.
In short there are many climatic challenges facing farmers, growers and the wider food sector, and many of them are simply not known yet. We’re all learning in this process and no one has all the answers. Climate adaptation is every bit as important as climate mitigation in the farming world, and sometimes the answers for both mitigation and adaptation can be the same. Weatherproofing your farm should be a priority for all farmers and growers.
Short to medium term solutions
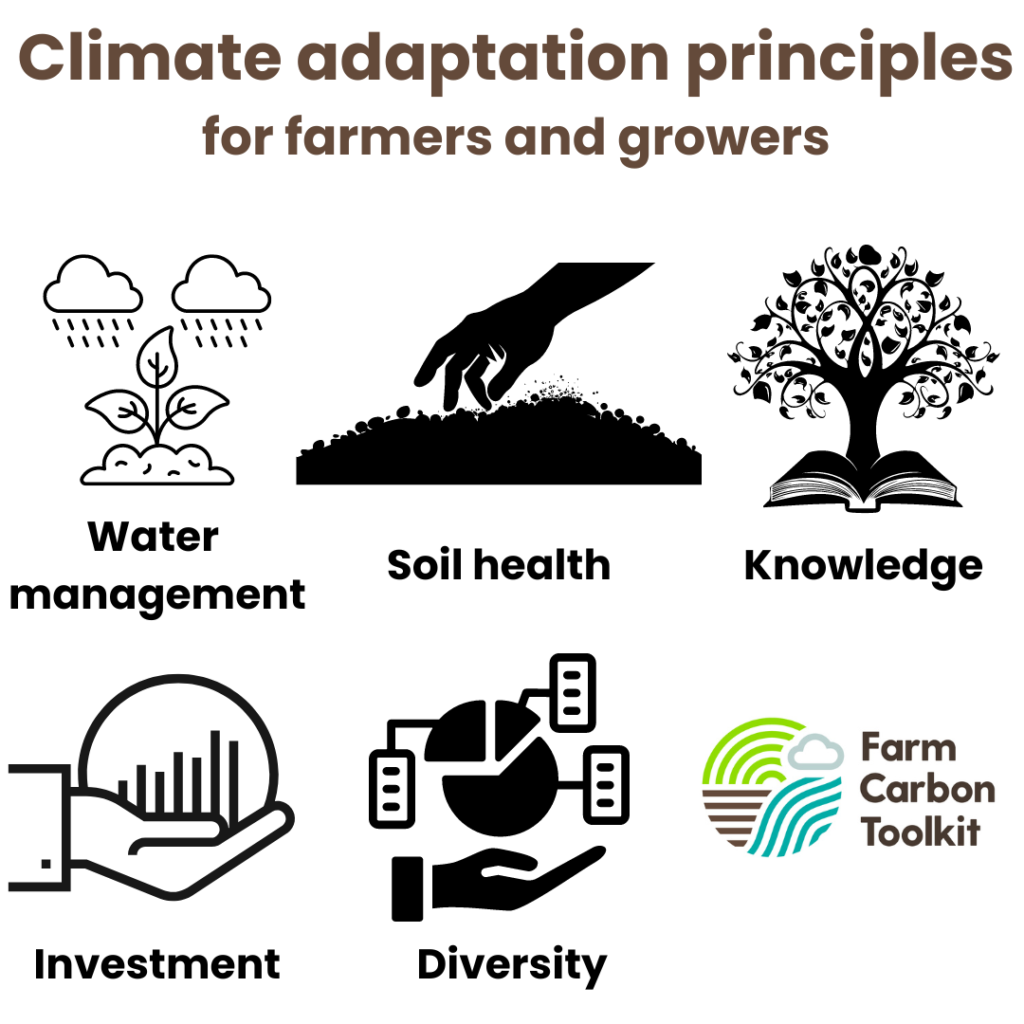
So what can you as a farmer or grower do about it? There are things out of our control – the location of our farms (well, unless you’re up for moving!) and the weather systems we receive, but there are plenty of things that can be done to adapt. We’ll look at our top five actions
Soil health
Water management
Diversity in the business
Knowledge of the trends
Investment in the future
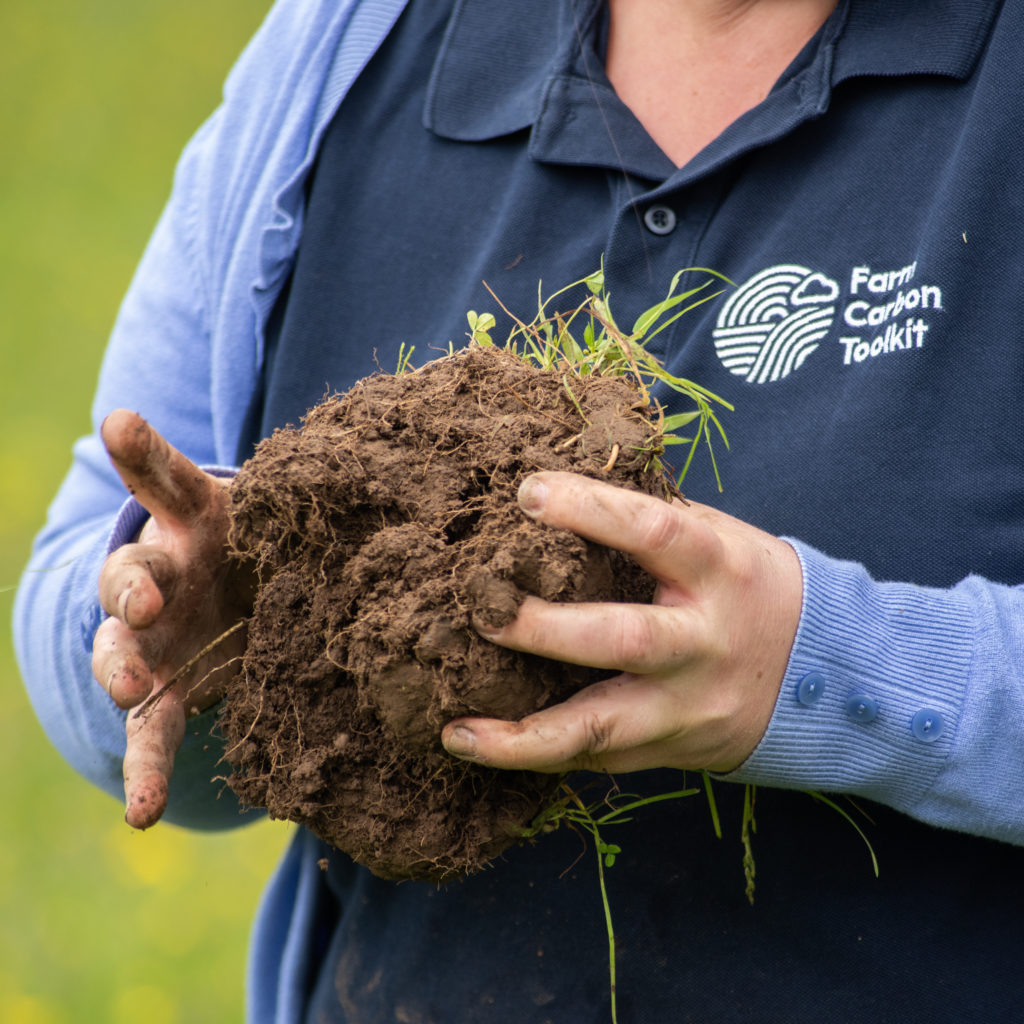
Soil underpins everything we do in farming, and a healthy soil can be incredibly resilient in terms of water management, soil health and structure. Increasing organic matter content, enhancing soil biology and minimising cultivation and compaction can have massive benefits.
Water is crucial for all plant growth, but having too much or too little can massively affect all crops, from grass to cereals and vegetables. A soil with good structure and good organic matter levels can help buffer against both flood and drought conditions. However, having plenty of available water for irrigation when needed can be essential for crops like vegetables and fruit. Most farms can improve their water storage capacity, harvest more rain water and implement efficient irrigation systems.
Diversity of enterprises on the farm will help guard against the danger of having all your eggs in one basket. Inevitably some crops or products do better than others in different years. This might mean a range of crop types, genetic diversity within a particular crop, or branching out to try different breeds of plants and livestock. A biodiverse farm can also help regulate extreme weather events, even changing the micro climate of a farm.
Knowledge of the farmer or grower is one of the most powerful tools. Understanding what a changing climate might look like for the farm, and planning ahead is vital to build resilience and guard against risks from extreme weather.
Investment in the future could be the key to business resilience. For example, identifying that the farming system would benefit from more trees, water storage, different cultivation equipment, livestock sheds, etc. This forward planning and investment should be strongly considered if and when finances allow. Grants are also available, such as those offered by Defra.
Longer term solutions
At Farm Carbon Toolkit (FCT) we work with businesses every day to create Carbon Action Plans, where we recommend short, medium and long term solutions; Climate Adaptation Plans should be seen in a similar way. Having said that, making a long term plan to cut carbon is much easier in its aim – to cut net carbon emissions to zero or beyond. But with climate adaptation plans – what is the aim?
That question is hard to answer as the climate of the future is uncertain. But what do we know is true? Well, the climate we’re used to is changing , as are weather patterns. Predictions are currently largely coming to pass, and so that gives us some guidance. Bearing in mind they are just predictions, one thing is certain – farms need to be resilient, adaptable and well prepared. It is likely the future will not look much like the past.
Change can be very challenging, especially in businesses like farming which are inherently long term. Embracing change can be difficult for many reasons – resources, money, land capability, mindset, tradition and much more. But burying our heads in the sand is also not viable – this is difficult, but it is happening!
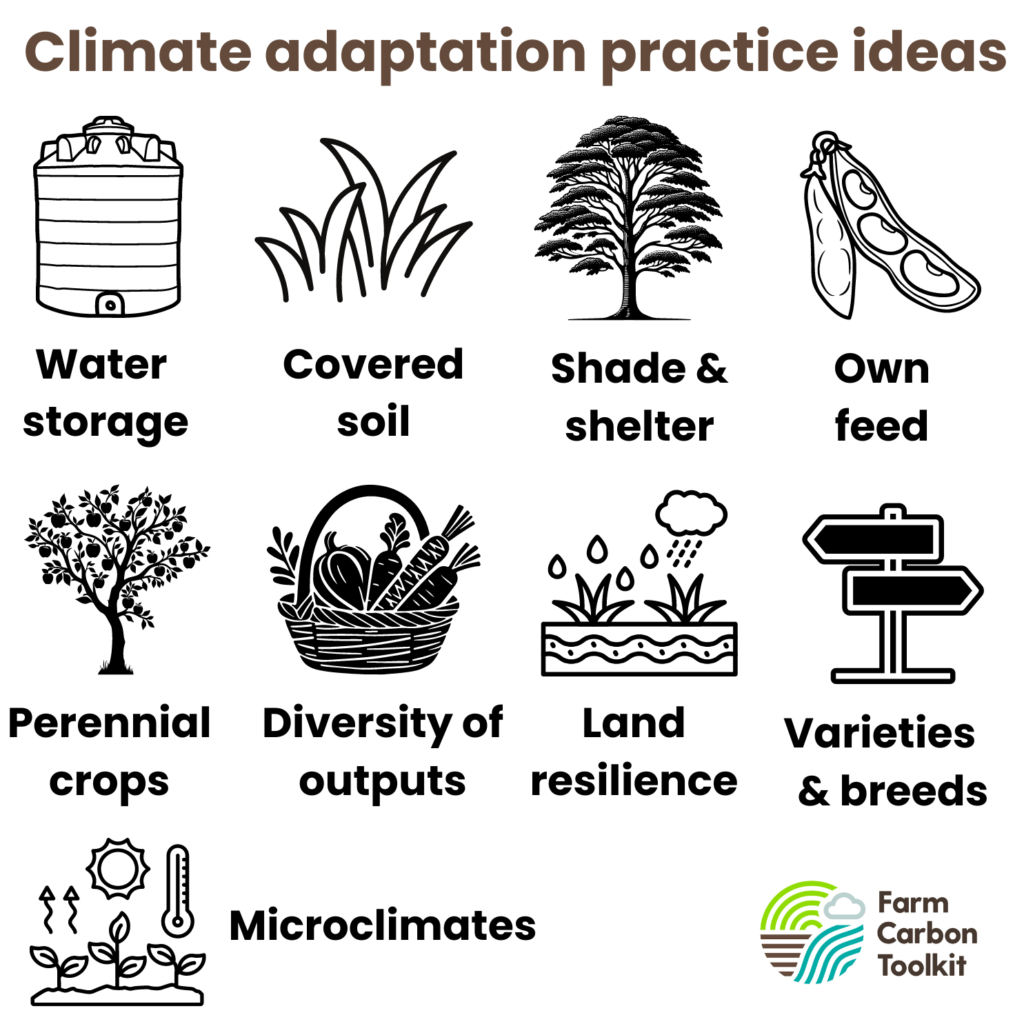
Here are some areas to consider:
Cultivated soils are particularly vulnerable to soil erosion, drought and flooding. Moving towards reduced cultivation and better soil that is permanently covered will build resilience
Adapting land use to be more resilient to intense rainfall events
Livestock can be very vulnerable to heat and extreme weather. Providing shade and shelter can help reduce the impacts on animals
Animal feed supply can be impacted significantly by weather, in terms of price, availability and quality. Are there ways to boost feed self-sufficiency and feedstock resilience for the farm?
Perennial crops tend to be more resilient than annual crops. Opportunities might exist to shift cropping systems to build resilience
Diversity of farm outputs may help to reduce the number of “eggs in one basket” and spread climate-related risks
Microclimates can help farms to adapt. Trees, hedges and agroforestry can help to provide shade, manage water, and shelter from storms, as well as offering alternative income streams
Water storage can improve in quantity and ability to deliver water to crops, in combination with soils that have improved water holding capacity.
Varieties and breeds that are adapted to your local soils and climate may do better than others, for example population wheat. Local seed breeding is a skill that has largely been lost to most farmers and growers.
Whatever future path is chosen by farmers looking to adapt to a changing climate, two themes are clear. Firstly, that no one solution will work and a pathway should be holistic. Secondly, those plans should be adaptable and may well have to change. The future is uncertain, but a resilient business that has planned ahead has a better chance in weathering future storms. FCT can help you in that planning.
Helping you
An increased focus for us at Farm Carbon Toolkit will be to help you with services, tools, techniques and insights to adapt to a changing climate. We have over 15 years experience in helping farmers and growers to measure, understand and reduce their carbon footprint. We have a range of services, and a team of experts who really understand farming. Increasingly we will be doing more to help you both reduce your carbon footprint, and adapt to a changing climate.
One gram of soil can contain one billion bacteria and up to 10,000 different species of bacteria with only 1% of organisms estimated to have been identified.
The soil functions as part of a vital living system which supports crop and animal health, underpinned by massively complex interactions between the biological, chemical, and physical properties of the soil. Life in the soil is often underestimated, spanning millions of species and billions of organisms which account for the highest concentration of biomass from anywhere on the planet. Fertility and crop performance are at risk of being distilled down to the chemical or physical constraints of the soil in isolation. This encourages an oversimplified approach to soil management. Sustainable Land Management, and the move towards regenerative agriculture encourages a more holistic management of the soil, resulting in enhanced biological diversity and so delivering the key benefits. It is important to recognize the importance of soil biology without overthinking its complexity, after all, we cannot manage for individual microbial species.
Soil Microorganisms
Soil microorganisms describe both bacteria and fungi, whose abundance makes up much of the biological biomass in the soil. Bacteria and fungi produce a range of enzymes which can break down and absorb inorganic and organic matter which is later made readily available as nutrients to plant roots. Fungal communities form larger hyphae ‘networks’ which are beneficial in mobilising nutrients in mutualistic exchanges with rooting structures. These fungal hyphae can extend over great distances and further help with the aggregation of the soil, improving soil stability, water holding capacity and therefore a greater resilience to droughts and waterlogging.
Bacteria exudates form the ‘glues’ which facilitate the formation of microaggregates from soil particles and as well as increasing the cycling of nutrients with a particular focus on the nitrogen cycle. Both fungi and bacteria are responsible for the breakdown of organic matters within the soil profile and so populations benefit greatly from manure applications.
Due to their short life cycles, the population of these organisms may shift rapidly as a result of changes to their environment including the soil temperature, moisture and chemical composition. A healthier soil will generally have higher microbial biomass and will benefit from a larger fungal-to-bacterial ratio. Applications of agrochemicals and fertilisers can impact populations with overapplications of nitrogen promoting a more bacterially dominated soil. Likewise, tillage can break up the fungal hyphae which are more sensitive to physical disturbance.
Soil Macrofauna
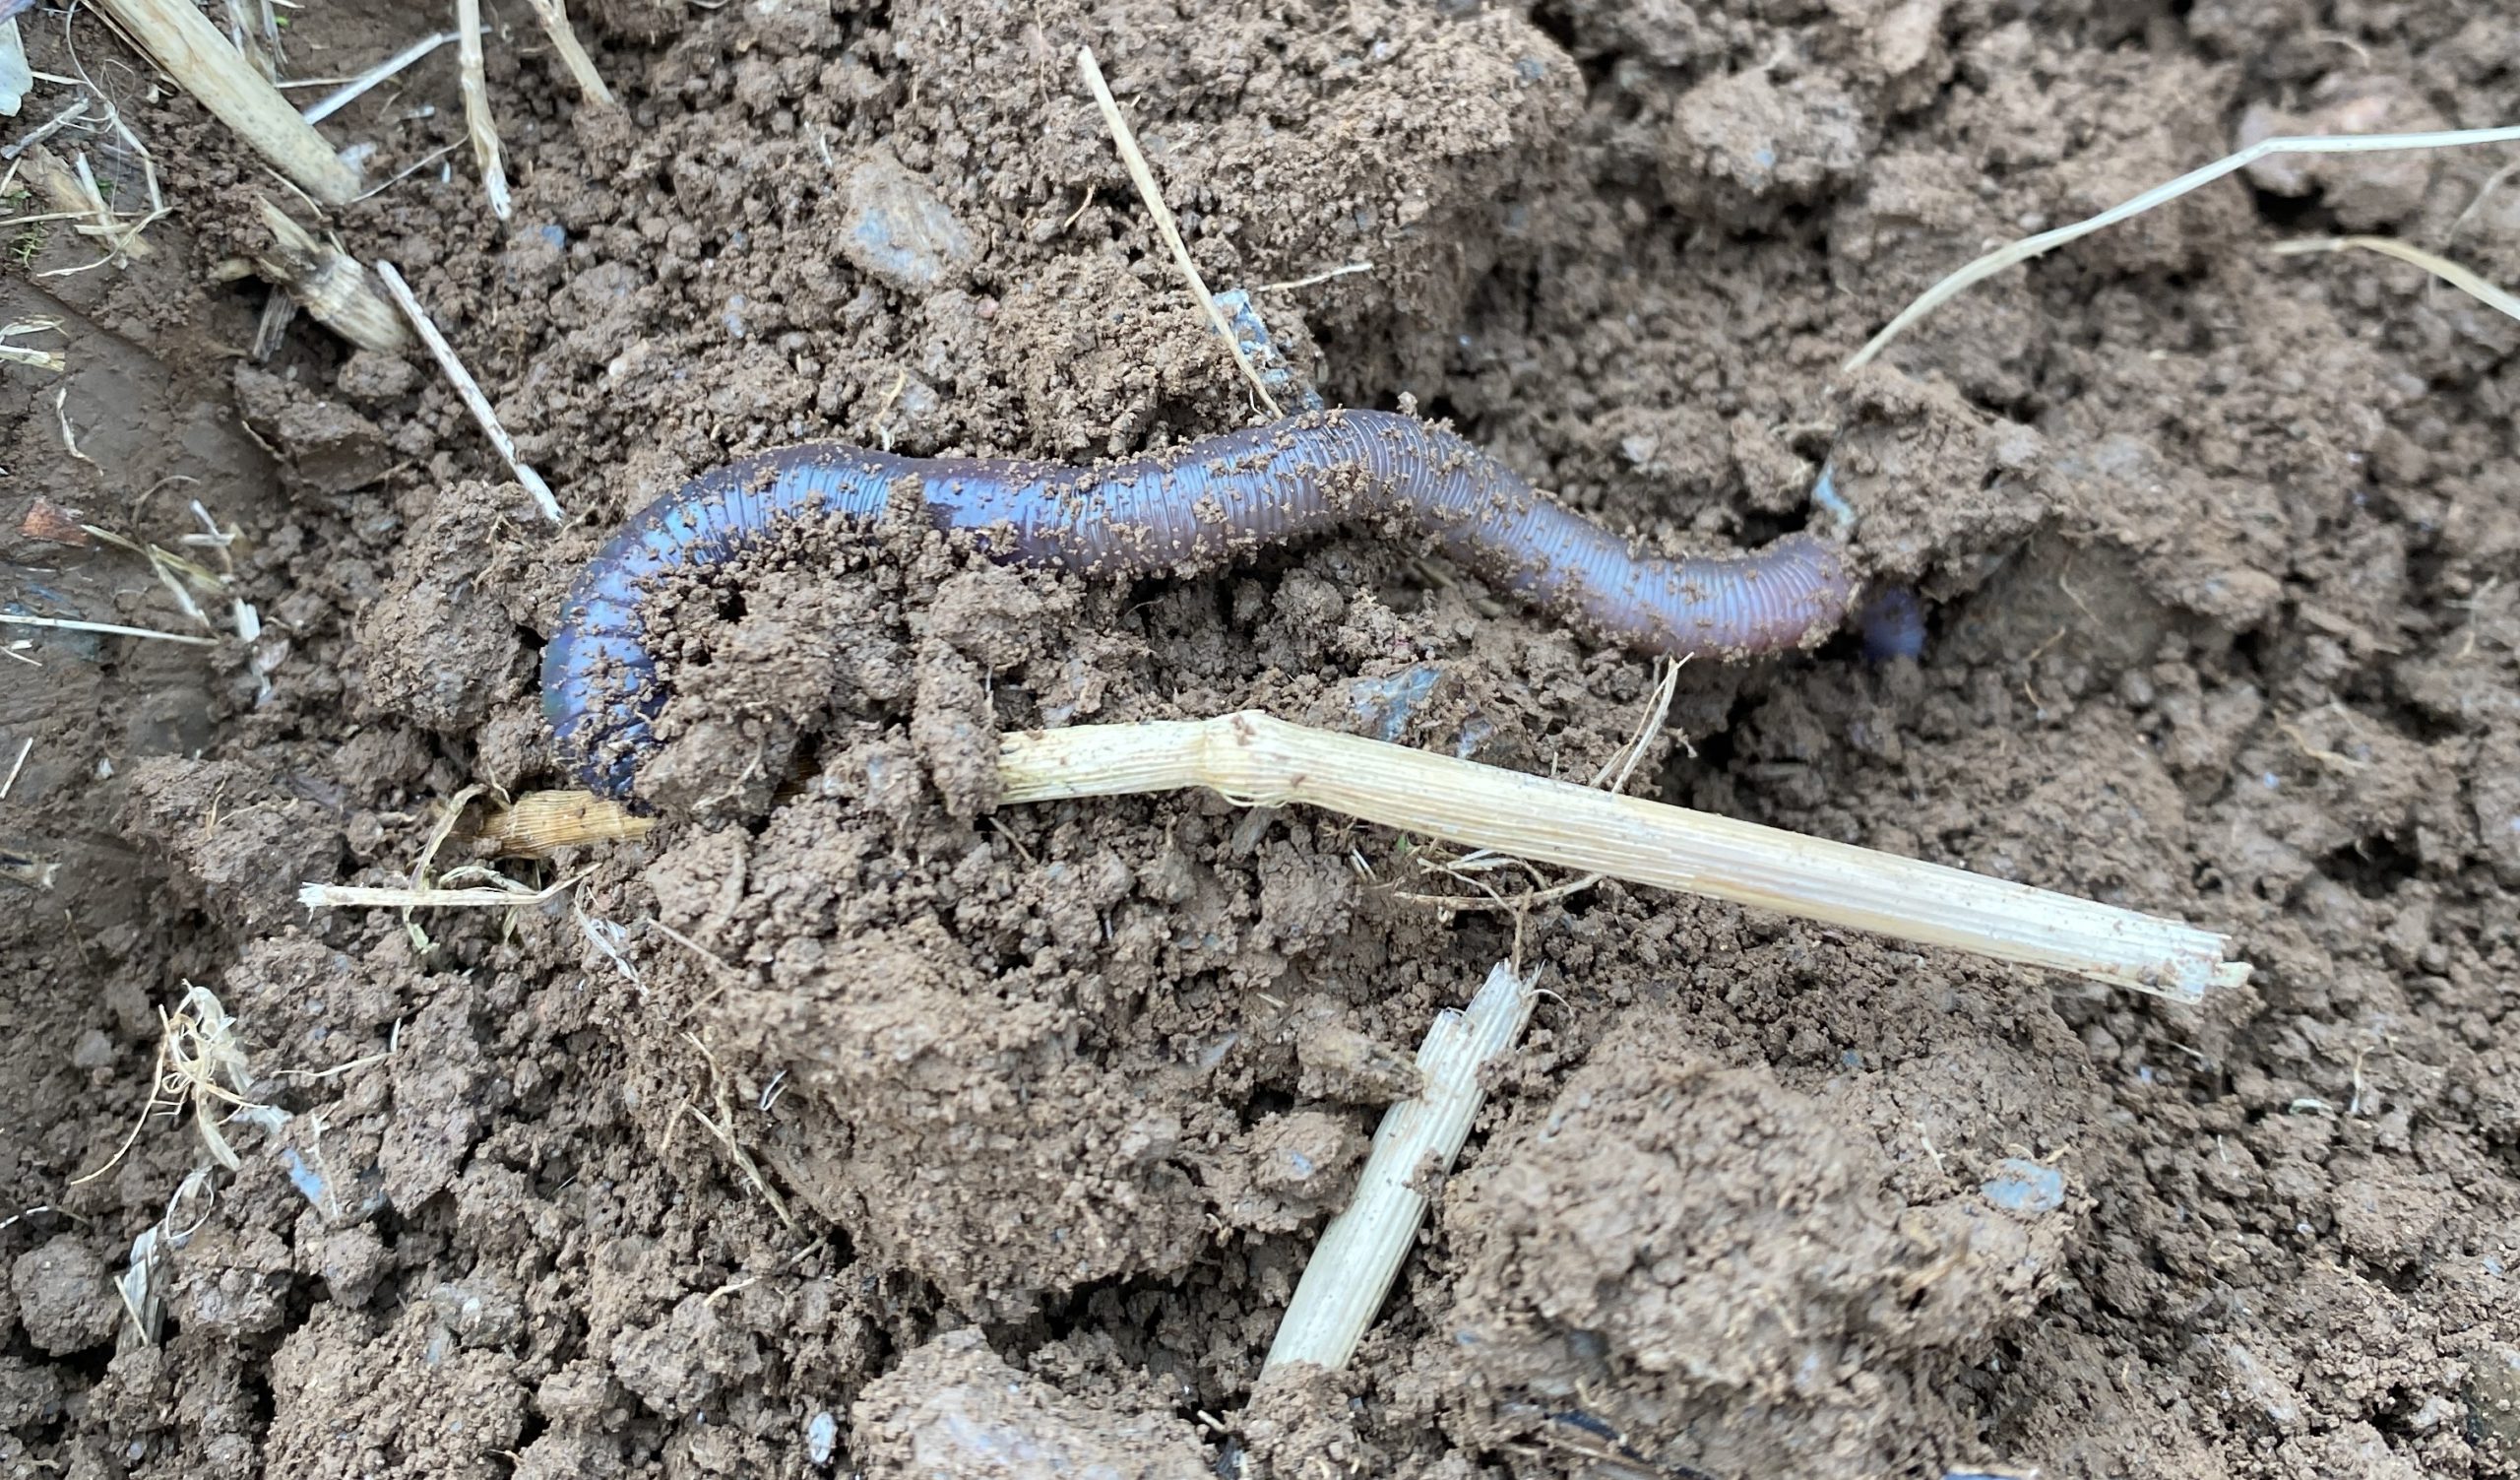
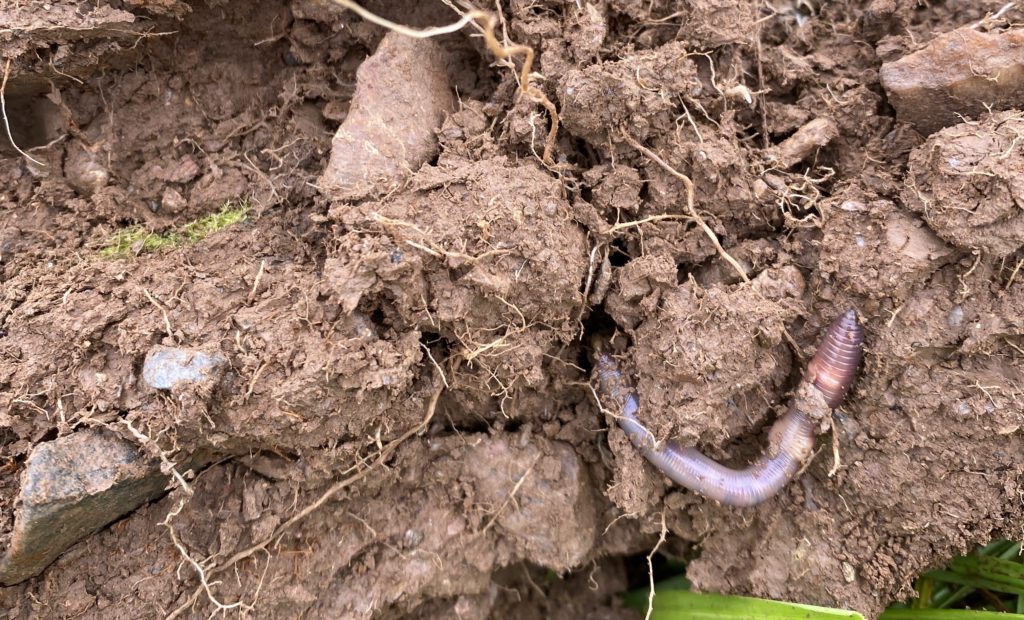
The macrofauna are larger organisms which inhabit the soil with perhaps the most notable being the earthworm. Not only do earthworms operate as ecosystem engineers to enhance the soil and provide a better environment for other plants and animals to reside but they are an excellent indicator of soil health. Whilst it can be difficult to measure soil biodiversity the presence of earthworms indicate, on a larger scale, a healthy operating food web with a distribution of organisms across all trophic levels. As such earthworm numbers have become a good metric for biological soil health which are a result of and have an impact upon the chemical and physical properties of the soil. Earthworms fulfill different functions based on their niche, with the three main groups being:
Epigeic – Inhabit litter layer and cycle carbon
Endogeic – Topsoil dwelling and enhance soil aggregation and nutrient mobilisation
Anecic – Deep burrowing improving porosity, water infiltration and root development
Considerations for Biological Soils
Feed the soil: amendments of organic matter will benefit soil organisms as it provides a feed source for them to thrive on. Conversely the greater the soil fauna populations the quicker and more available the nutrients. Over applications of inorganic fertility sources can have a negative impact causing the soil to become too bacterially dominated.
Crop diversity: the greater the crop diversity the greater the diversity in below-ground populations as there is a greater range of plants to feed and interact with in the growing environment. This necessitates the implementation of more diverse crop rotations into arable systems and will benefit from greater diversity in grassland with the inclusion of legumes and herbs.
Reduced tillage: tillage can have an adverse effect on established populations of soil organisms from the fungal hyphae all the way up to the earthworms. A move towards less intensive tillage through the adoption of no-till or min-till establishment at suitable parts of the rotation will help to maintain soil biological populations.
Overall, the biological component of the soil should not be overlooked as it is an essential part of a vital, living soil. Allowing soil to function properly will bring a host of benefits which can result in real world cost savings. Chief among these benefits may be the increased resilience in a changing climate.
Welcome to our April Farm Net Zero newsletter, sharing updates for our farmers, growers and the wider community this project supports.
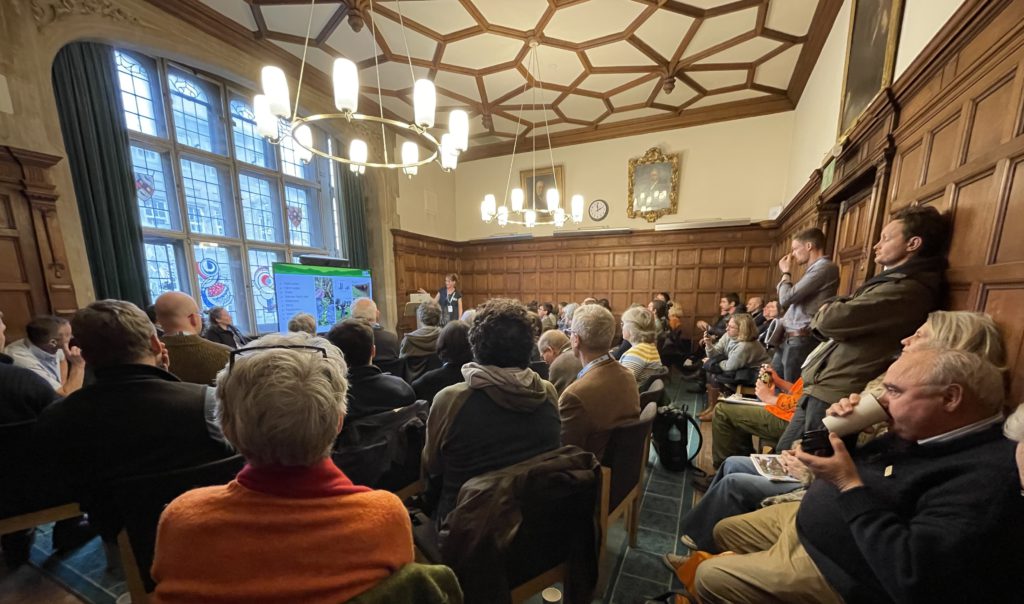
(Image above: Dr Hannah Jones/FCT presenting at the ORFC)
Recent news and events
Oxford Real Farming Conference: January 2024
An intrepid band of Farm Net Zero farmers and project staff made their way to Oxford for the Real Farming Conference where we were presenting a session called “It Takes a Farm Community to be Net Zero: A Case Study from Cornwall”. This was a sell-out, with people queuing to get in, and helped to demonstrate the excellent work the FNZ farmers are doing as part of their communities. The film we produced was well-received, even earning a “whoop” from the crowd! It is available to watch here: https://farmcarbontoolkit.org.uk/2024/01/18/five-farms-in-cornwall/.
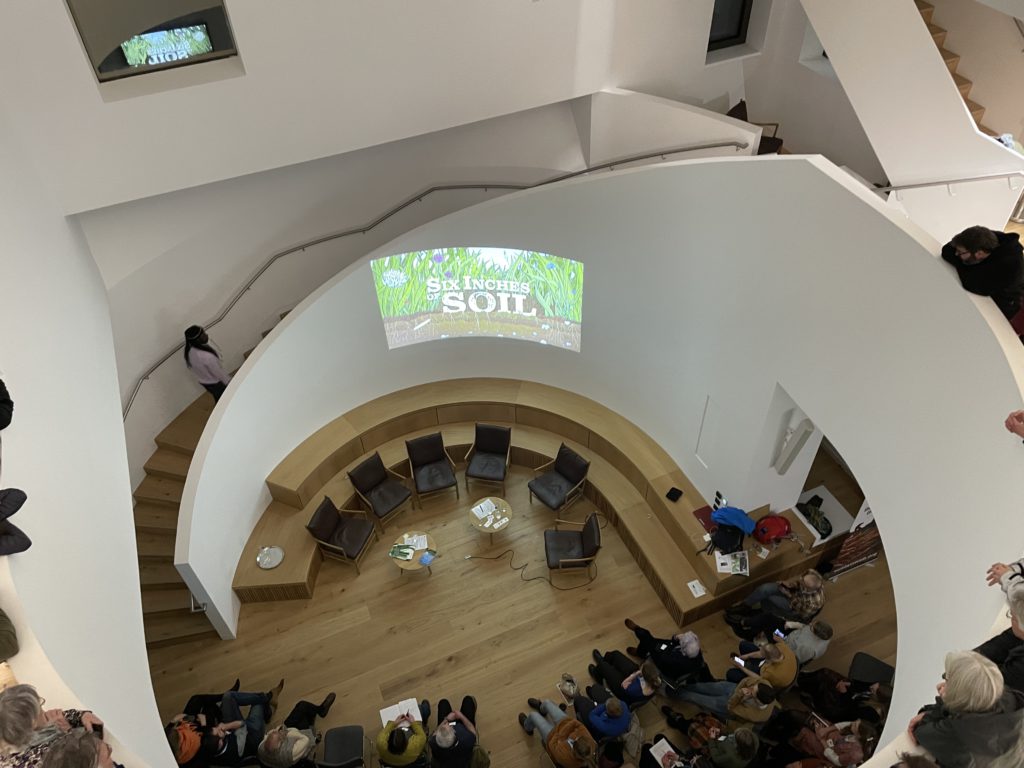
As well as the impressive range of sessions we were able to attend (covering everything from the role of vets in ecological sustainability to farm succession planning), we watched the premiere of “Six Inches of Soil” – a new film about farming starring Farm Net Zero monitor farmer Ben Thomas and featuring Farm Net Zero’s own Hannah Jones.
Premiere of “Six Inches of Soil”
Community film screening 25th March
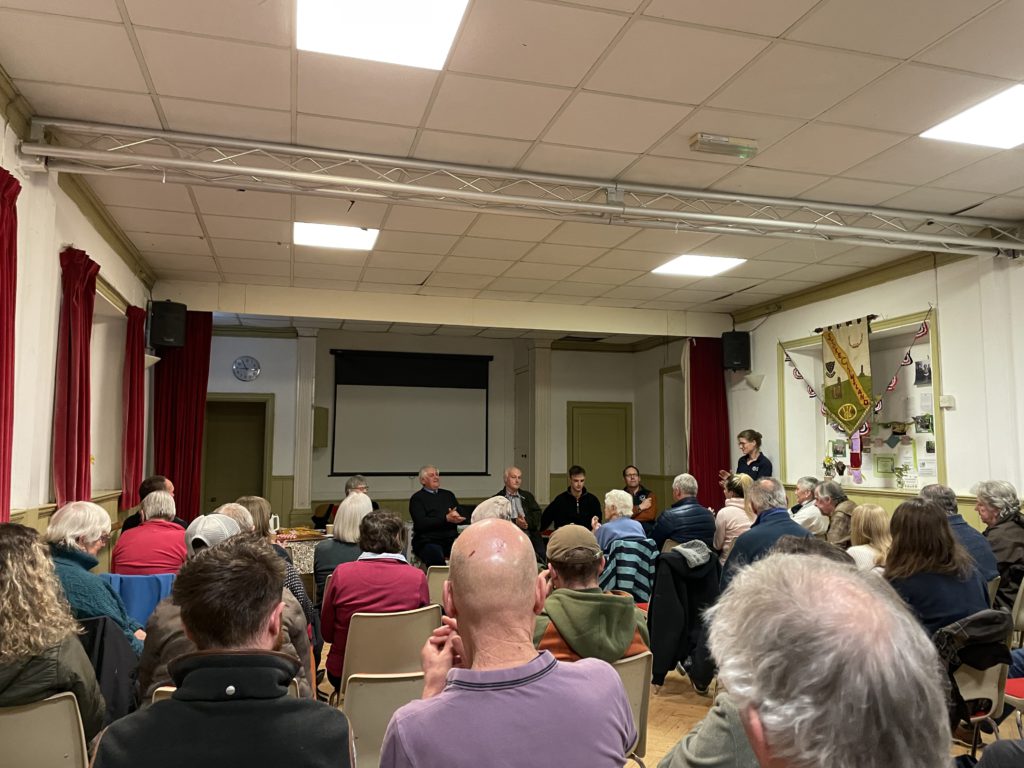
On Monday 25th March, we showed the Farm Net Zero Community Film at Stoke Climsland Parish Hall. This event was very well attended by members of the local community, drummed up by Bonny Lightfoot and Martin Howlett, FNZ monitor farmers and stars of the film. Following the screening, there was a panel session with the farmers where attendees were able to ask questions on climate change, biodiversity and how the project farmers are working together to address these issues.
We ended the session with the farmers’ visions of farming in the future, with all agreeing that there will be more of a mix and integration between farming and nature.
Community film screening
“Filming on Your Phone” Workshop
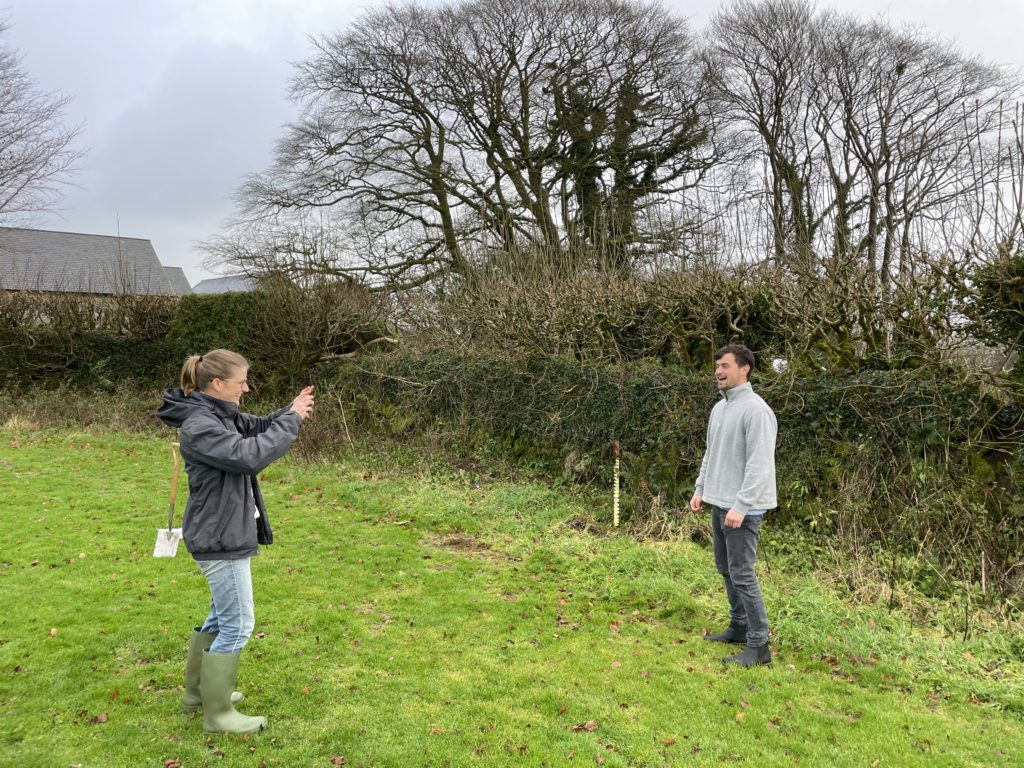
We ran our second “Filming on Your Phone” workshop with Down to Earth Media just before Christmas. This gave a group of farmers the opportunity to learn about how to share their stories and the good work they are doing. Since the start of the project, 12 farmers have now received media training.
“Filming on Your Phone” workshop – Sam Roberts of Blable Farm being filmed!
The success of Farm Net Zero has led to a short project funded through Cornwall Council’s Shared Prosperity Fund, to work with farms in Cornwall on carbon, biodiversity and water management plans. This project is a collaboration between the Rural Business School, Farm Carbon Toolkit, Westcountry Rivers Trust and Cornwall Wildlife Trust. If you are a farmer interested in taking part, please contact [email protected]
Falmouth Climate Change event
The Farm Net Zero team was present at the Climate Change Exhibition held at the Polytechnic (“the Poly”) in Falmouth on March 8th and 9th. The event, which was organised by Falmouth Rotary Club, was aimed at raising awareness amongst the general public. We were able to share some of our great work with passers-by, and as a result of our presence at the event, we have been asked to host a visit by two Cornish MPs this Spring.
Demo farm and field lab update
Inter-cropping cabbage
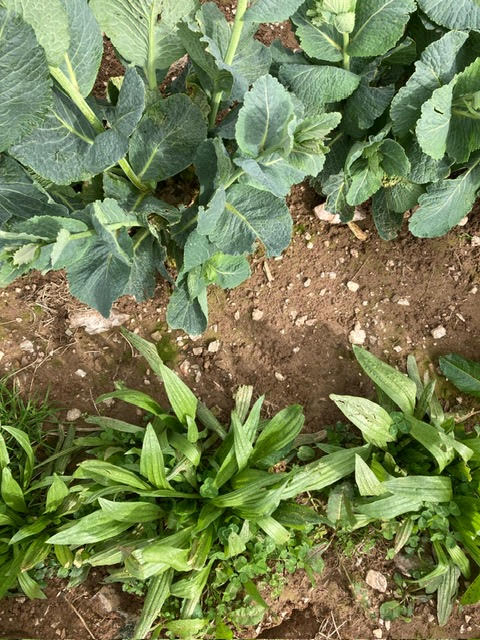
The inter-crop sampling for the cabbages has just been completed at Ennis Barton, one of our FNZ demo farms. This is a collaboration between Andrew Brewer and Andy Williams of Riviera Produce Ltd. Soil samples have been sent away for assessment of soil organic matter, but it is the impact on soil aggregate stability, and water infiltration that is of particular interest in this short term winter cover crop. A mix of buckwheat , phacelia, white clover, plantain and chicory was broadcast between cabbages in 4 blocks across 4 fields and compared to the control treatment of no cover crop. More data to follow.
Winter cover crop between harvested Savoy cabbages ready for grazing until reseeding with grass in May.
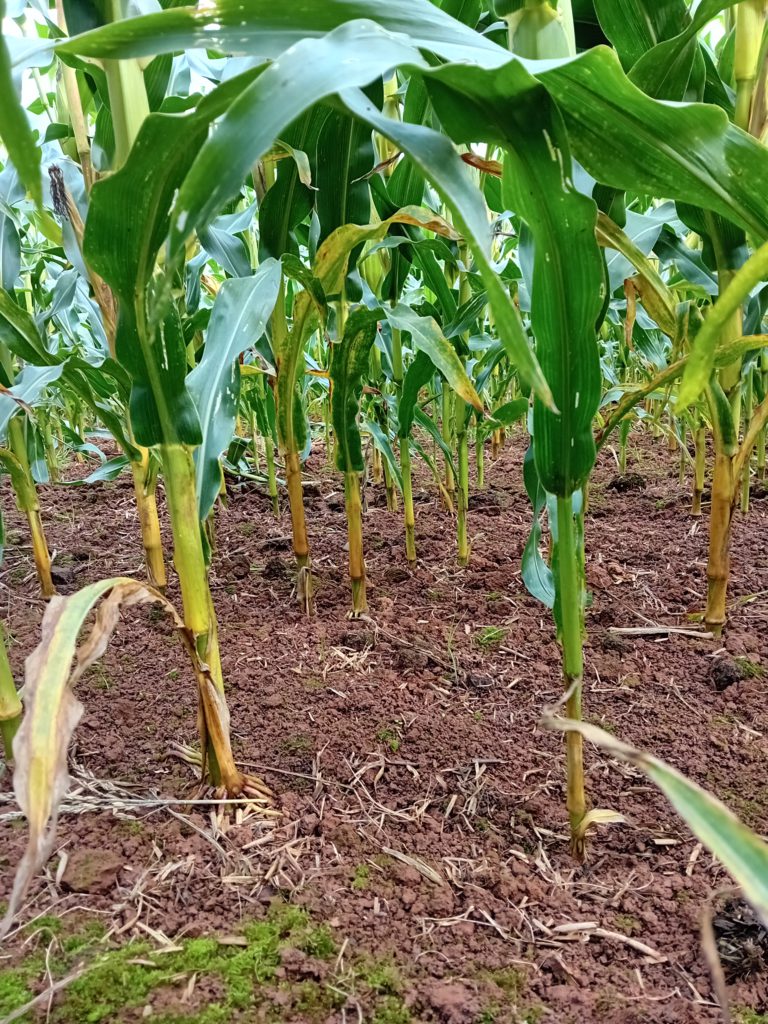
Farm Net Zero maize trials
This is the second year of the FNZ – Innovative Farmers maize field lab. This trial is evaluating the effects of different establishment methods, such as strip till and under sowing, on maize yield and soil health. For example, at Duchy College the trial plans involve splitting a maize field between conventional establishment and reduced cultivation and then trialling undersown mixtures in the opposite direction across the field.
This year we have teamed up with Plymouth University who will be carrying out some more in-depth soil testing. If you’re interested in taking part in the trials please do get in touch: [email protected].
We have a meeting planned for the triallists and researchers on 3rd April near Bodmin.
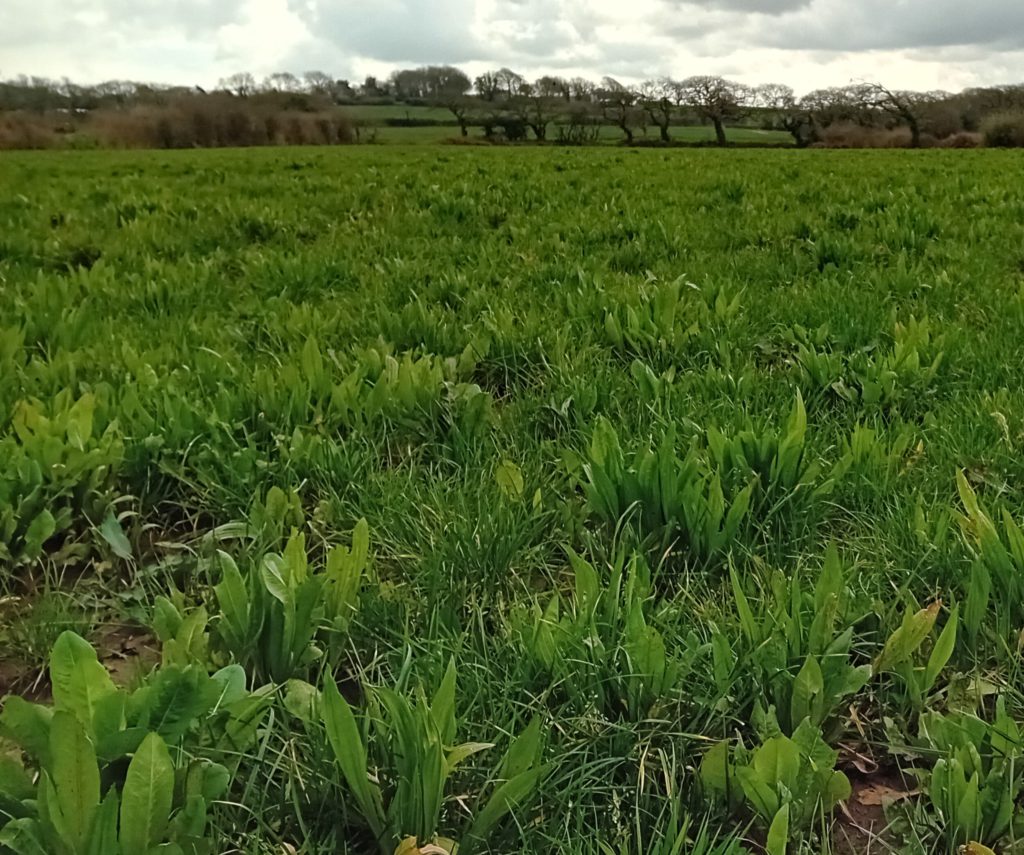
Diverse covers and leys to reduce worm burden at weaning
Weaning shock in lambs can cause physiological stress and slow growth rates. But this effect could be offset by enhanced forage protein content.
Two of our monitor farmers, Matt Smith and Anthony Ellis, have teamed up with the Farm Carbon Toolkit to launch a new Farm Net Zero trial, examining the effect of protein rich cover crops on lamb growth rates. This Innovative Farmers field lab will test a bespoke chicory-rich mixture for lamb weaning. The farmers hope it will improve growth rates, reduce lamb production footprint, improve soil health and lamb welfare, as well as reduce the need for wormers.
Andrew will split his dairy herd, grazing one group on standard ryegrass and clover leys, and the other on diverse swards/ herbal leys. Forage samples will be taken ahead of the cows moving in to graze. The milk yield and constituents from the trial cows will then be measured regularly throughout the 2024 growing season.
and Cornwall Wildlife Trust and will deal with the big question many dairy farmers want answered. Dr Daniel Enriquez Hidalgo of University of Bristol, has been leading the study design and will be carrying out the results analysis. We are grateful to Andrew for all the extra hard work the trial will involve.
Conor Kendrew from Cornwall Wildlife Trust sampling forage at Ennis Barton farm
Dock Control Field Lab
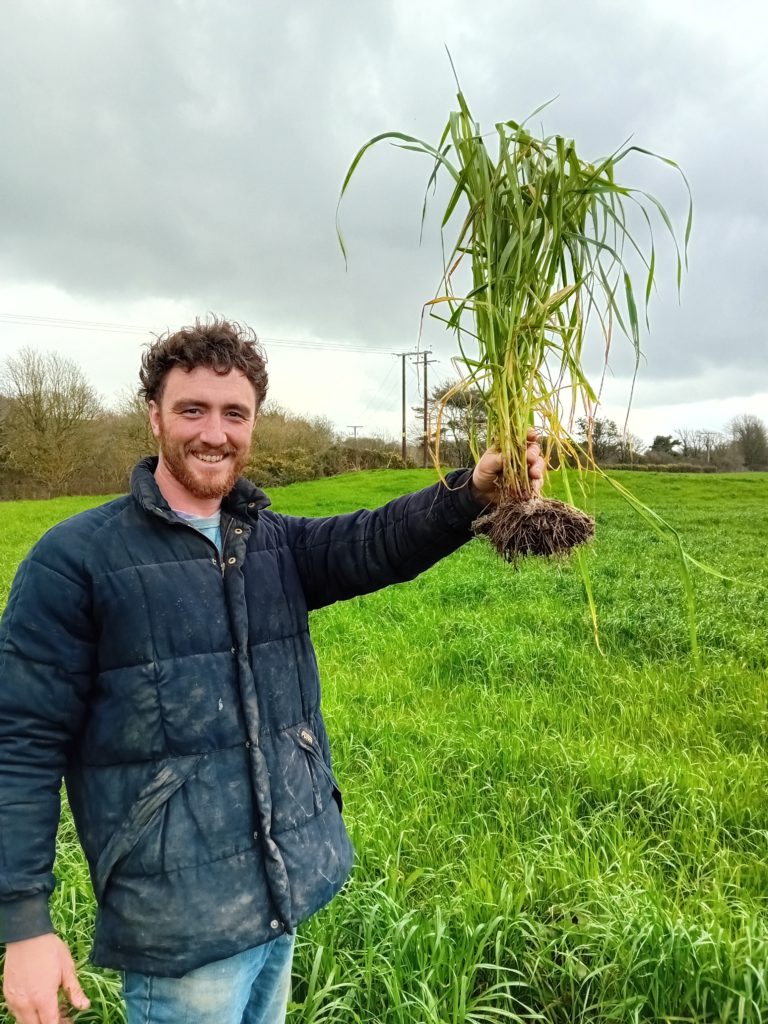
Last years ‘How to rejuvenate pastures’ hosted by James Barrett has led to a new field lab. James rotaseeded a dock-infested grassland and destroyed docks just by addressing surface compaction.
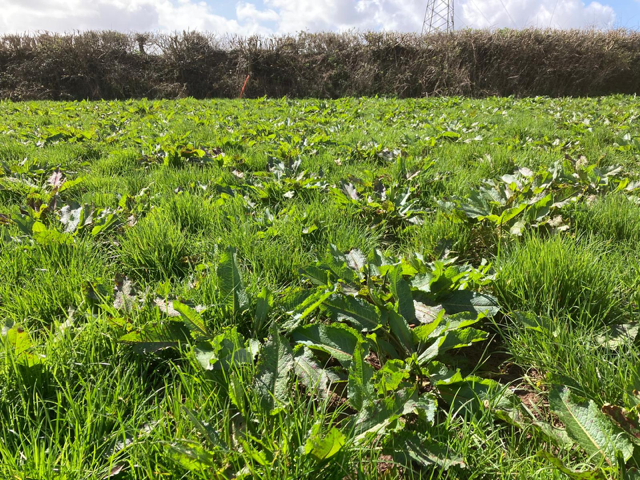
Dock infestation of pasture
Calcium levels were also found to be at good levels in the soil. The new field lab will be recruiting up to 10 farmers, a field each, to test out the impact of optimising soil structure through mechanical intervention and the use of granular and foliar calcium application. Please contact a member of the FNZ team if you would like to be involved.
What next?
Workshop “Gardening & Trees” – with FNZ & Nourish Kernow,
Sunday April 21st, 1:30pm – 4pm, Higher Culloden Farm, College Road, Camelford, PL32 9TL
Learn about the environmental benefits of planting trees, shrubs, and perennial plants alongside food crops. The event will include a hands-on soil health assessment that you can try at home, plus ideas to help you manage your garden to best sequester carbon and adapt to a changing climate, as well as boosting biodiversity.
We will be taking a look at the trees recently planted at the farm to support its habitat management plan and hearing about the inspiration and challenges behind the farm’s wider Community Supported Agriculture project to create a regenerative market garden on the edge of town.
Have fun as you learn about the environmental benefits of planting trees, shrubs, and perennial plants alongside food crops at home.
We will be continuing to run a series of Farm Net Zero events in 2024, drawing on the needs and interests from the community of farmers. These will be advertised on our website and through this newsletter. If you have any suggestions for events we could run, please let us know.
As ever, if you have any questions or ideas that would further support the community of farmers that we are working with, please get in touch with the project team (contact details below).
All information about the project including upcoming events and resources are available on the Farm Net Zero website. If there is anything you would like to see featured please let us know.
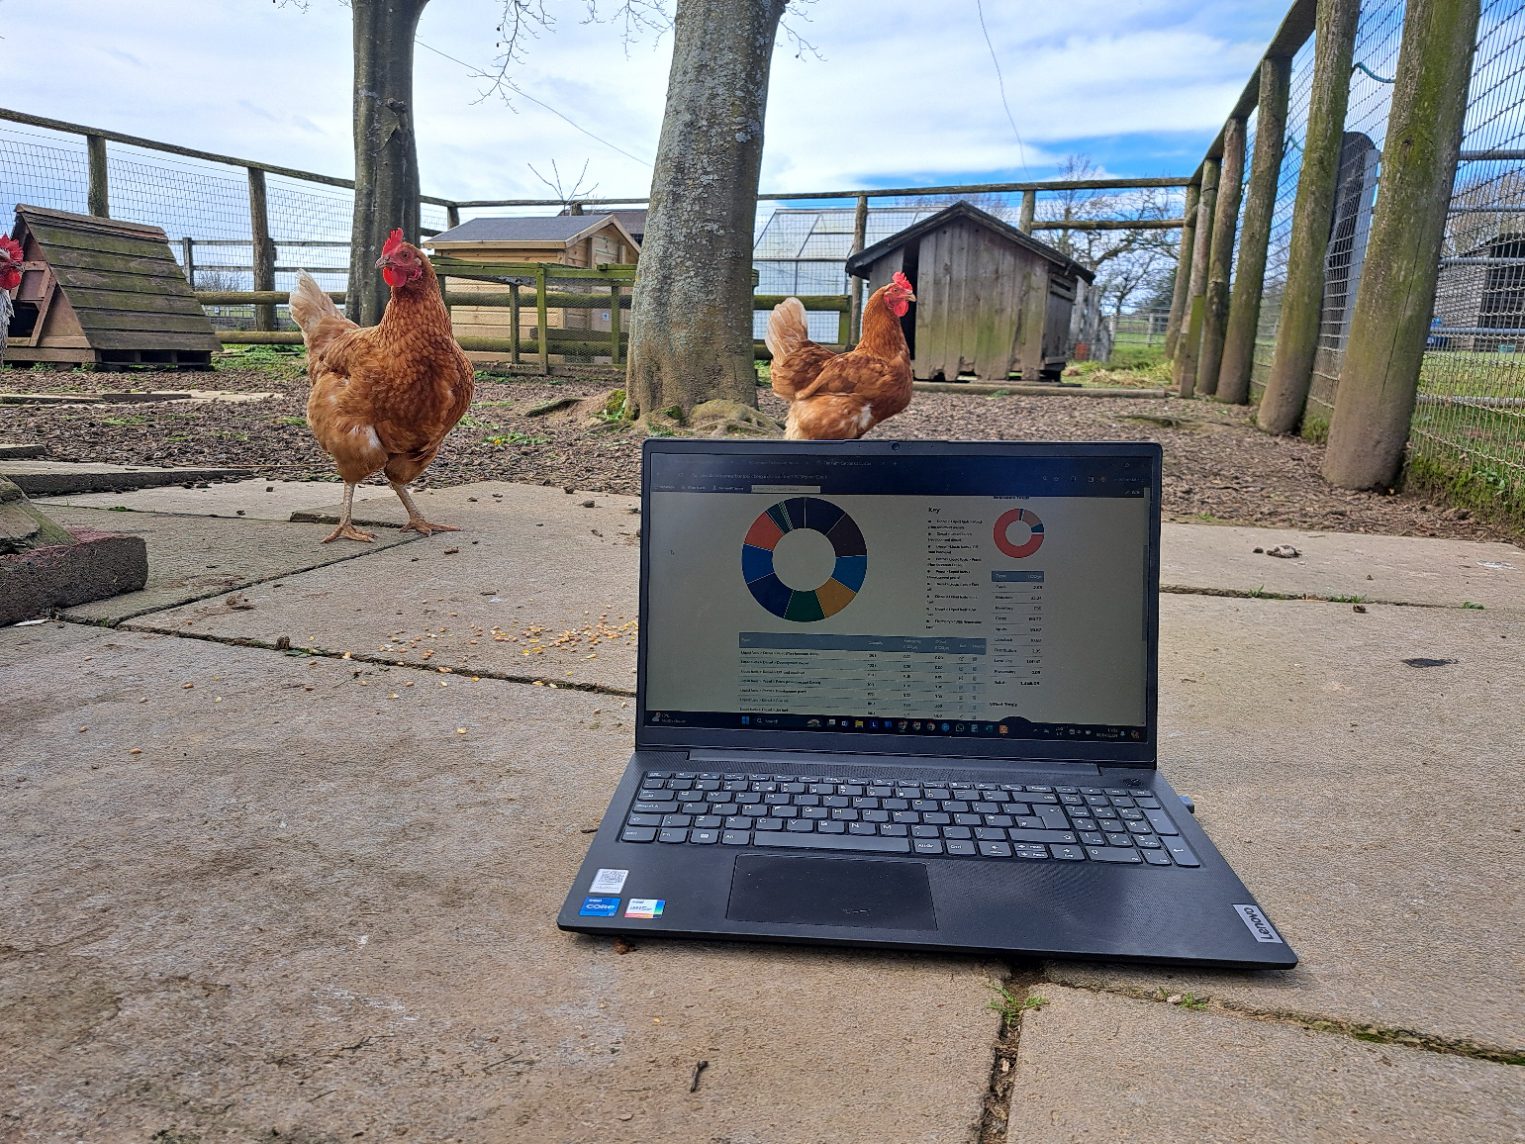
The calculator just got a little bit bigger and better
This October all calculator users will benefit from an incremental update to The Farm Carbon Calculator. We’re always looking and listening for ways to improve the tool – and in accordance with our annual development cycle we’ve added some as quickly as we can in this update.
The changes described below change our transparent methodology, and are listed in detail in an update note – read it
Calculated emissions adapt to reflect your crop management decisions
We know there are a wide range of practices around how crops are harvested or managed. Whereas before we relied on averages to calculate emissions here, now you can account for the specific way you manage each crop. The more detail you can enter, the more accurate your footprint will be.
The update applies to all crops – here’s some examples and the new ways the calculator estimates related emissions from these:
For agricultural crops like barley you can now choose from options relating to the amount of crop residue – you will see the following options:
Most of the barley straw left in the field
Half of the barley straw removed, half left in field (default)
Wholecrop or most of the barley straw removed from the field.
For your horticultural crops like potatoes you can also indicate what happened to residues:
Most of the crop residues left in field (default)
Most of the residues removed after harvest.
For green manures, temporary grasslands and cut forages select from the following:
Green manure with all residues left in field after mowing (default)
Forage crop with half of the residues foraged in place
Cash crop with all residues removed from the field.
Where you don’t have the detail to enter we revert back to a sensible default which suits the crop in question. So don’t worry – we’ve done this so the Calculator remains easy to use and crops can be entered just as before where needed.
Emissions now calculated from fruit crops
Until now the Calculator has accounted for fruit crops so yields can be recorded. Our research has reached a level of detail where we can confidently indicate emissions associated with this fruit yield – whereas before we could only account for sequestration from perennial fruit crops.
Emissions are now calculated from the growing the fruits alongside detail on their management and their renewal rate where applicable. It is this level of detail that has allowed us to take this step – which we think greatly improves the calculator for fruit farms.
Log in to see emissions for: Blackberries, Blackcurrants, Blueberries, Cranberries, Gooseberries, Raspberries, Redcurrants, Strawberries, Apples, Cherries, Grapes, Hops, Kiwiberries, Nuts, Pears, and Plums.
Better record of the operations and activities on your farm
Accounting for fuel use and farming operations just got even easier. We’ve increased the amount of modelled emissions for different farm operations by working closely with industry professionals.
If you don’t have all your fuel use figures but you know what farming operations you completed or contracted out, we’re confident you will be able to record this. Choose from 47 different activities like drilling, harvesting, soil preparation, bailing and much more. You’ll know the number of different types of operations needed on your farm – it’s likely that if you do it, we can help estimate emissions from it.
Here’s an example of the options now available under the general category of baling:
Running a bale wrapper
Baling by the bale – Small rectangular bales
Baling by the bale – Round bales
Baling by the bale – Heston bales
Baling by area ~250 Small rectangular bales per ha
Baling by area ~15 Round bales per ha
Baling by area ~7.5 Heston bales per ha
Baling by area (general).
More detail to capture your unique farm’s purchases and waste
We listened to feedback and added more options to help record unique purchases on your farm for your carbon footprint report. All farms are different so you may not see all these changes but here are the main additions:
There are more material items accounted for in our already extensive list; things like sheep hurdles; packaging used by dairy producers and in veg boxes; and a range of cleaning products, detergents and disinfectants
More items thrown away or disposed of can be simply accounted for by selecting options from our extensive list
If you produce your own hay and haylage this can be recorded, alongside silage and straw, feed and bedding. Following our updates to crops on-farm, this detail allows more of what you do to be recorded – though it doesn’t necessarily result in emissions calculations. You’ll find full details of what creates emissions within the calculator as you enter each item, and in our methodology and update note.
Better visibility of Greenhouse gas type and scope
When a report is downloaded in CSV or JSON formats you will now receive a more detailed split of greenhouse gas for each item on your report, which is also broken down by emissions scope. We’ve been asked for this from farmers and agricultural professionals using the calculator – often those reporting onward emissions to others in the supply chain looking for this detail.
Your reports won’t change
We know consistent reporting is important to you so we have ensured carbon reports in our system will not automatically change because of this update. This means all your calculated figures will stay the same.
Do note however that if you modify an old report by adding items to it, or if you click ‘recalculate’ then your report will update in the relevant places based on this update. You may want to update it, particularly if you have crops in your report, as you may want to see changes due to the improved accuracies mentioned.
If you want to preserve your old report but also change or build scenarios from it, you can lock your report so it cannot change and create a copy of any report from your dashboard to begin making alterations. Name these reports so you can easily tell them apart. Talk to us if you are not sure and we can advise you.
When is our next update?
These updates are scheduled to take place at least twice per year with an incremental update in Autumn and a larger annual update in Spring.
We are here for farmers and users and our updates like this reflect all our priorities. We engage our farmer network and the Farm Carbon Toolkit team in the update process by gathering feedback on how the current version is working alongside suggested improvements. We order the feedback we receive by quality and what is achievable, and plan our next upgrade in accordance with our ongoing schedule.
We’d love to hear from you
Our friendly team can be reached to help answer your questions – talk to us.
Remember there are a range of resources for users of the Calculator and useful FAQs and videos too.
The FCT Calculator team has released a significant update to the Farm Carbon Calculator, designed to ensure that your reports reflect the latest emissions data and understanding available. This update, which will affect any reports ending after 1st April 2024, encompass a range of improvements aimed at enhancing report accuracy, flexibility and calculator usability. Below are some of the main changes you will see to the calculator.
Updated emissions factors
We want to ensure that your reports align with the most recent scientific research and methodologies, and to that end we have updated our emissions factors across various categories, including:
Updated UK GHG Inventory factors to the latest data (affects fuels, materials, distribution, processing, inventory and waste)
Updated the livestock, cropping and input emissions factors in line with the most recent IPCC standard refinements
Updated woodland sequestration factors in accordance with the latest Woodland Carbon Code
Numerous other emissions factors have been updated across the calculator, and for a more extensive breakdown of these changes, see Table 1 of our “What’s new for April 2024 update” document on the Calculator resources page.
New factor options
In this update we have also expanded the options available when report building to offer more comprehensive coverage of farm businesses. The new factors we have added include:
New fuel options such as alternative diesels and purchased heat and steam
Diverse new material options, such as more fencing materials, piping options, packaging choices, and agricultural consumables.
Expanded imported organic fertility and cropping options, including whole cropping
New fertiliser (including liquid fertilisers) and spray options, with provisions for unlisted items
Inclusion of hay and haylage as livestock feed options
Expanded distribution options, including electric vehicle haulage and various air freight options
Alongside adding new options, we have provided some more refined options for existing factors in the calculator, including:
New managed hedgerow options, to allow reports to reflect the higher biomass accumulation of young hedges
We now have a non-UK electricity option for international users, allowing you to input your emissions using your nation’s specific emissions conversion factor
More options for structures, including new agricultural building size options and various new complete fencing options
A full overview of the new additions and refined items are available in Table 2 of the “What’s new for April 2024 update” document, as well as flagged in the new data collection sheets available on our Calculator resources page.
Accounting for Capital Items
With this update we have provided more flexibility in how capital items (such as farm machinery or agricultural buildings) are accounted for to ensure that your reports are in line with your desired reporting approach. You can choose to account for capital items in two ways:
“Depreciating over 10 years” – The legacy method with emissions “spread” over a 10 year period
“Upfront” – an approach which is compliant with the GHG protocol agricultural guidance. This way embedded emissions from capital items are associated with the year they were purchased, and only the emissions from your reported period will be included in your report
Not all standards require the inclusion of capital items, so if you are producing a report for someone else you should check whether they want capital items included.
You can also switch between inventory reporting options by going to “Edit Farm Details” and you will not lose any data switching between the two.
Reporting waste
A new waste disposal reporting approach has been developed to ensure there is an accurate assessment of emission and these are accounted for in a GHG protocol compliant manner. How waste is reported can be selected on the report information page as with the new inventory options:
“Legacy” is the existing approach which compares emissions from disposing of wastes to what would have been emitted had the waste been sent to landfill (i.e. it includes “avoided emissions”)
“GHG protocol compliant” is the new recommended option as it discounts any “avoided emissions” and accounts just for the emissions resulting from the disposal method selected
New Data Collection Sheets
To facilitate data collection, we provide updated sheets with all new calculator items flagged for easy reference. You can find these on our Calculator resources page.
More information
For a more detailed overview of these changes and the methodologies behind them, please visit our Calculator resources page. Additionally, our website offers various help and guidance to assist you in reporting your farm businesses’ carbon footprint.
We are dedicated to providing an accurate and user-friendly carbon calculator that can help farmers improve their business and environmental resilience. This update has been the product of the hard work from our team in response to contributions and feedback from our users, so if you have any queries or insights for the calculator please email us at [email protected], and we will work to make this the most accessible and informative tool for you.
An intrepid band of Farm Net Zero farmers and project staff made their way to Oxford for the Real Farming Conference where we were presenting a session called “It Takes a Farm Community to be Net Zero: A Case Study from Cornwall”. This was a sell-out, with people queuing to get in, and helped to demonstrate the excellent work the FNZ farmers are doing as part of their communities. The film we produced was well-received, even earning a “whoop” from the crowd! It is available to watch here: https://farmcarbontoolkit.org.uk/2024/01/18/five-farms-in-cornwall/.
As well as the impressive range of sessions we were able to attend (covering everything from the role of vets in ecological sustainability to farm succession planning), we watched the premiere of “Six Inches of Soil” – a new film about farming starring Farm Net Zero monitor farmer Ben Thomas and featuring Farm Net Zero’s own Hannah Jones.
We are delighted to be able to invite you to attend this Farm Walk to hear from the team at Oakley Farm about how they run their arable farm following regenerative agriculture principles.
Farming with greenhouse gas emissions in mind, as well as all the other targets farmers work to, is fast becoming the norm.
Oakley Farm in South Lincolnshire has been in the Gent family for four generations. Now with father and son team Edward and Thomas managing the 800 ha business, they run their arable farm following regenerative agriculture principles.
Having already fully adopted minimal cultivations and the incorporation of cover crops across the farm, the team are now turning their attention to the potential to incorporate agroforestry and livestock onto their holding. Through continuously refining the management system Edward and Thomas have managed to produce 10 tonne/ha wheat crops with 150kg N and 30 litres diesel per hectare.
The farm walk will begin at 1.30pm and will provide an opportunity to find out more about Edward and Thomas’s strategy to reduce emissions on the farm and how this has benefited the business, leading Thomas to be named as one of FCT’s finalists in our first Carbon Farmer of the Year Competition.
The event will take place outside, please wear suitable clothing and footwear. Light refreshments will be provided.
How to book
This event is free but spaces are limited. Please book via our Eventbrite page by following this link
We are delighted to be able to invite you to attend this Farm Walk to hear from the team at Lockerley Estate about how they are working to reduce farm-based emissions whilst storing more carbon into soils and non-crop biomass.
Increasingly farming with greenhouse gas emissions in mind, as well as all the other targets farmers work to, is becoming the norm.
Lockerley Estate & Preston Farms, based near Stockbridge in Hampshire is a 2,000ha diverse estate which champions an approach to agriculture where biodiversity, soil health and the wellbeing of the community and future generations is at the heart of everything they do.
Craig Livingstone, Director of Farming & Estates, has four key aims to enable the estate to reduce emissions which are focussed on maximising soil carbon sequestration; reducing reliance on chemical inputs; using the wider estate to sequester more carbon and increasing the natural capital on the estate.
Event details
The farm walk will begin at 1.30pm and will provide an opportunity to find out more about Craig’s strategy to reduce emissions from the estate and how this has benefited the business, leading him to be named as one of FCT’s finalists in our first Carbon Farmer of the Year Competition.
The event will take place outside, please wear suitable clothing and footwear. Light refreshments will be provided.
How to book
This event is free but spaces are limited. Please book via our Eventbrite page by following this link.
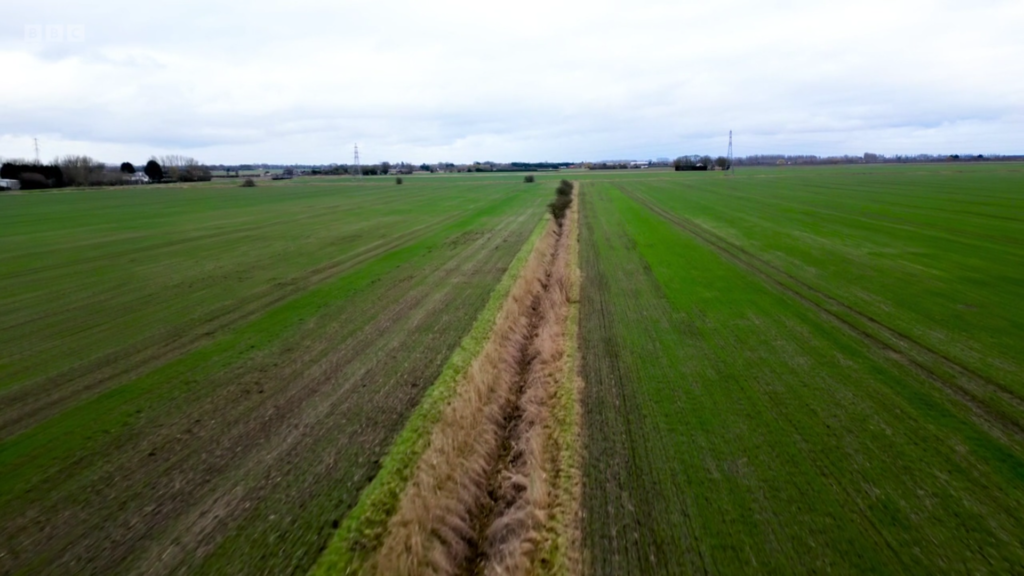
Looking back at 2023, it can safely be defined as a challenging year with the wettest autumn / winter we have seen for decades. Farmers have not only faced the challenge of maximising yields and optimising soil health, but also battling against the elements to drill crops into the ground. Hoping for a kinder 2024, this blog explores options to build resilience into crop rotations aiming to cultivate a balance between high yields and optimum soil health.
Minimising cultivation
First things first, this blog is not telling you to get rid of the plough. All machinery serves a purpose, it is just about knowing when to intervene. Within systems that have reduced their cultivations or those that have been adopting conservation ploughing (i.e. ploughing one year in three or more), soils tend to be more resilient through improved soil structure. Good soil structure has a matrix of small, medium, and large pore spaces able to retain and drain water as well as provide pockets of air for respiration and gaseous exchange and water for nutrient exchange. When we till the soil, especially when ground conditions are sub-optimum, we run the risk of squashing the pores and causing compaction and soil degradation, reducing water infiltration, increasing anaerobism (lack of oxygen) and building up toxic gases, all contributing to poor soil health and disappointing crop yields.
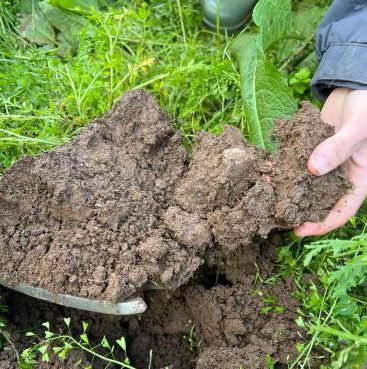
Carry out a VESS: Visual Evaluation of Soil Structure
It is important to get out there and dig holes; get to know your soil and how it behaves under certain environmental conditions. When you assess the soil structure, look for compaction and note its depth. Can this be remedied by deeper rooting species, or does it require mechanical intervention? Always keep the depth in mind as it’s no good going in too deep or too shallow.
Diversity
Sustainable rotations begin with diversity. A multipronged approach combining arable crops, legumes and cover crops takes full advantage of all the tools we have in the box as arable farmers. Diversity in species above ground matches diversity in species below ground: helping to break pest and disease cycles and improve soil health through provision of various rooting architecture, root exudates and crop residues. The soil is alive and many of the nutrients available to crops and plants come from the activity of soil-dwelling organisms that are busy stabilising, consuming and releasing nutrients for the benefit of the crop. Diversity in crops and roots therefore contribute a rich source of food for soil fauna to feast on, enhancing soil fertility and subsequent crop health and crop yield.
Where pests and disease more commonly thrive is within monocultures e.g. continuous cereals. We are seeing an increasing reliance on chemicals to control and abate problems within these systems, depleting our soils of beneficials in the process. Similarly, a lack of diversity in roots are only supporting a limited community of microorganisms. This is not sustainable; therefore, we must explore how we can incorporate more species within the rotation. OSR is one of many good examples. It has deep roots and is easily diversified with companions e.g. vetch / buckwheat / berseem clover. Maximising the number of crop species in a rotation will optimise the diversity of organisms below ground.
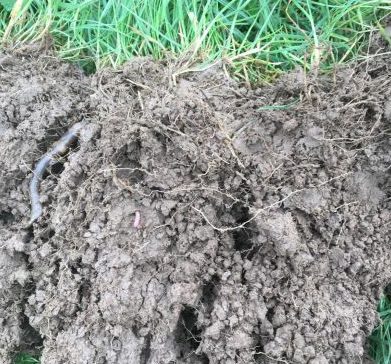
On farm, an easy way to measure how biologically active our soils are is by monitoring earthworm numbers. Earthworms are at the top of the soil food web and will travel to and reside where there is lots of food; they are also brilliant at breaking down residues and redistributing nutrients throughout the soil profile. How many worms do you count in a spade full of soil? Where are you finding the most? And can those numbers be replicated elsewhere on farm?
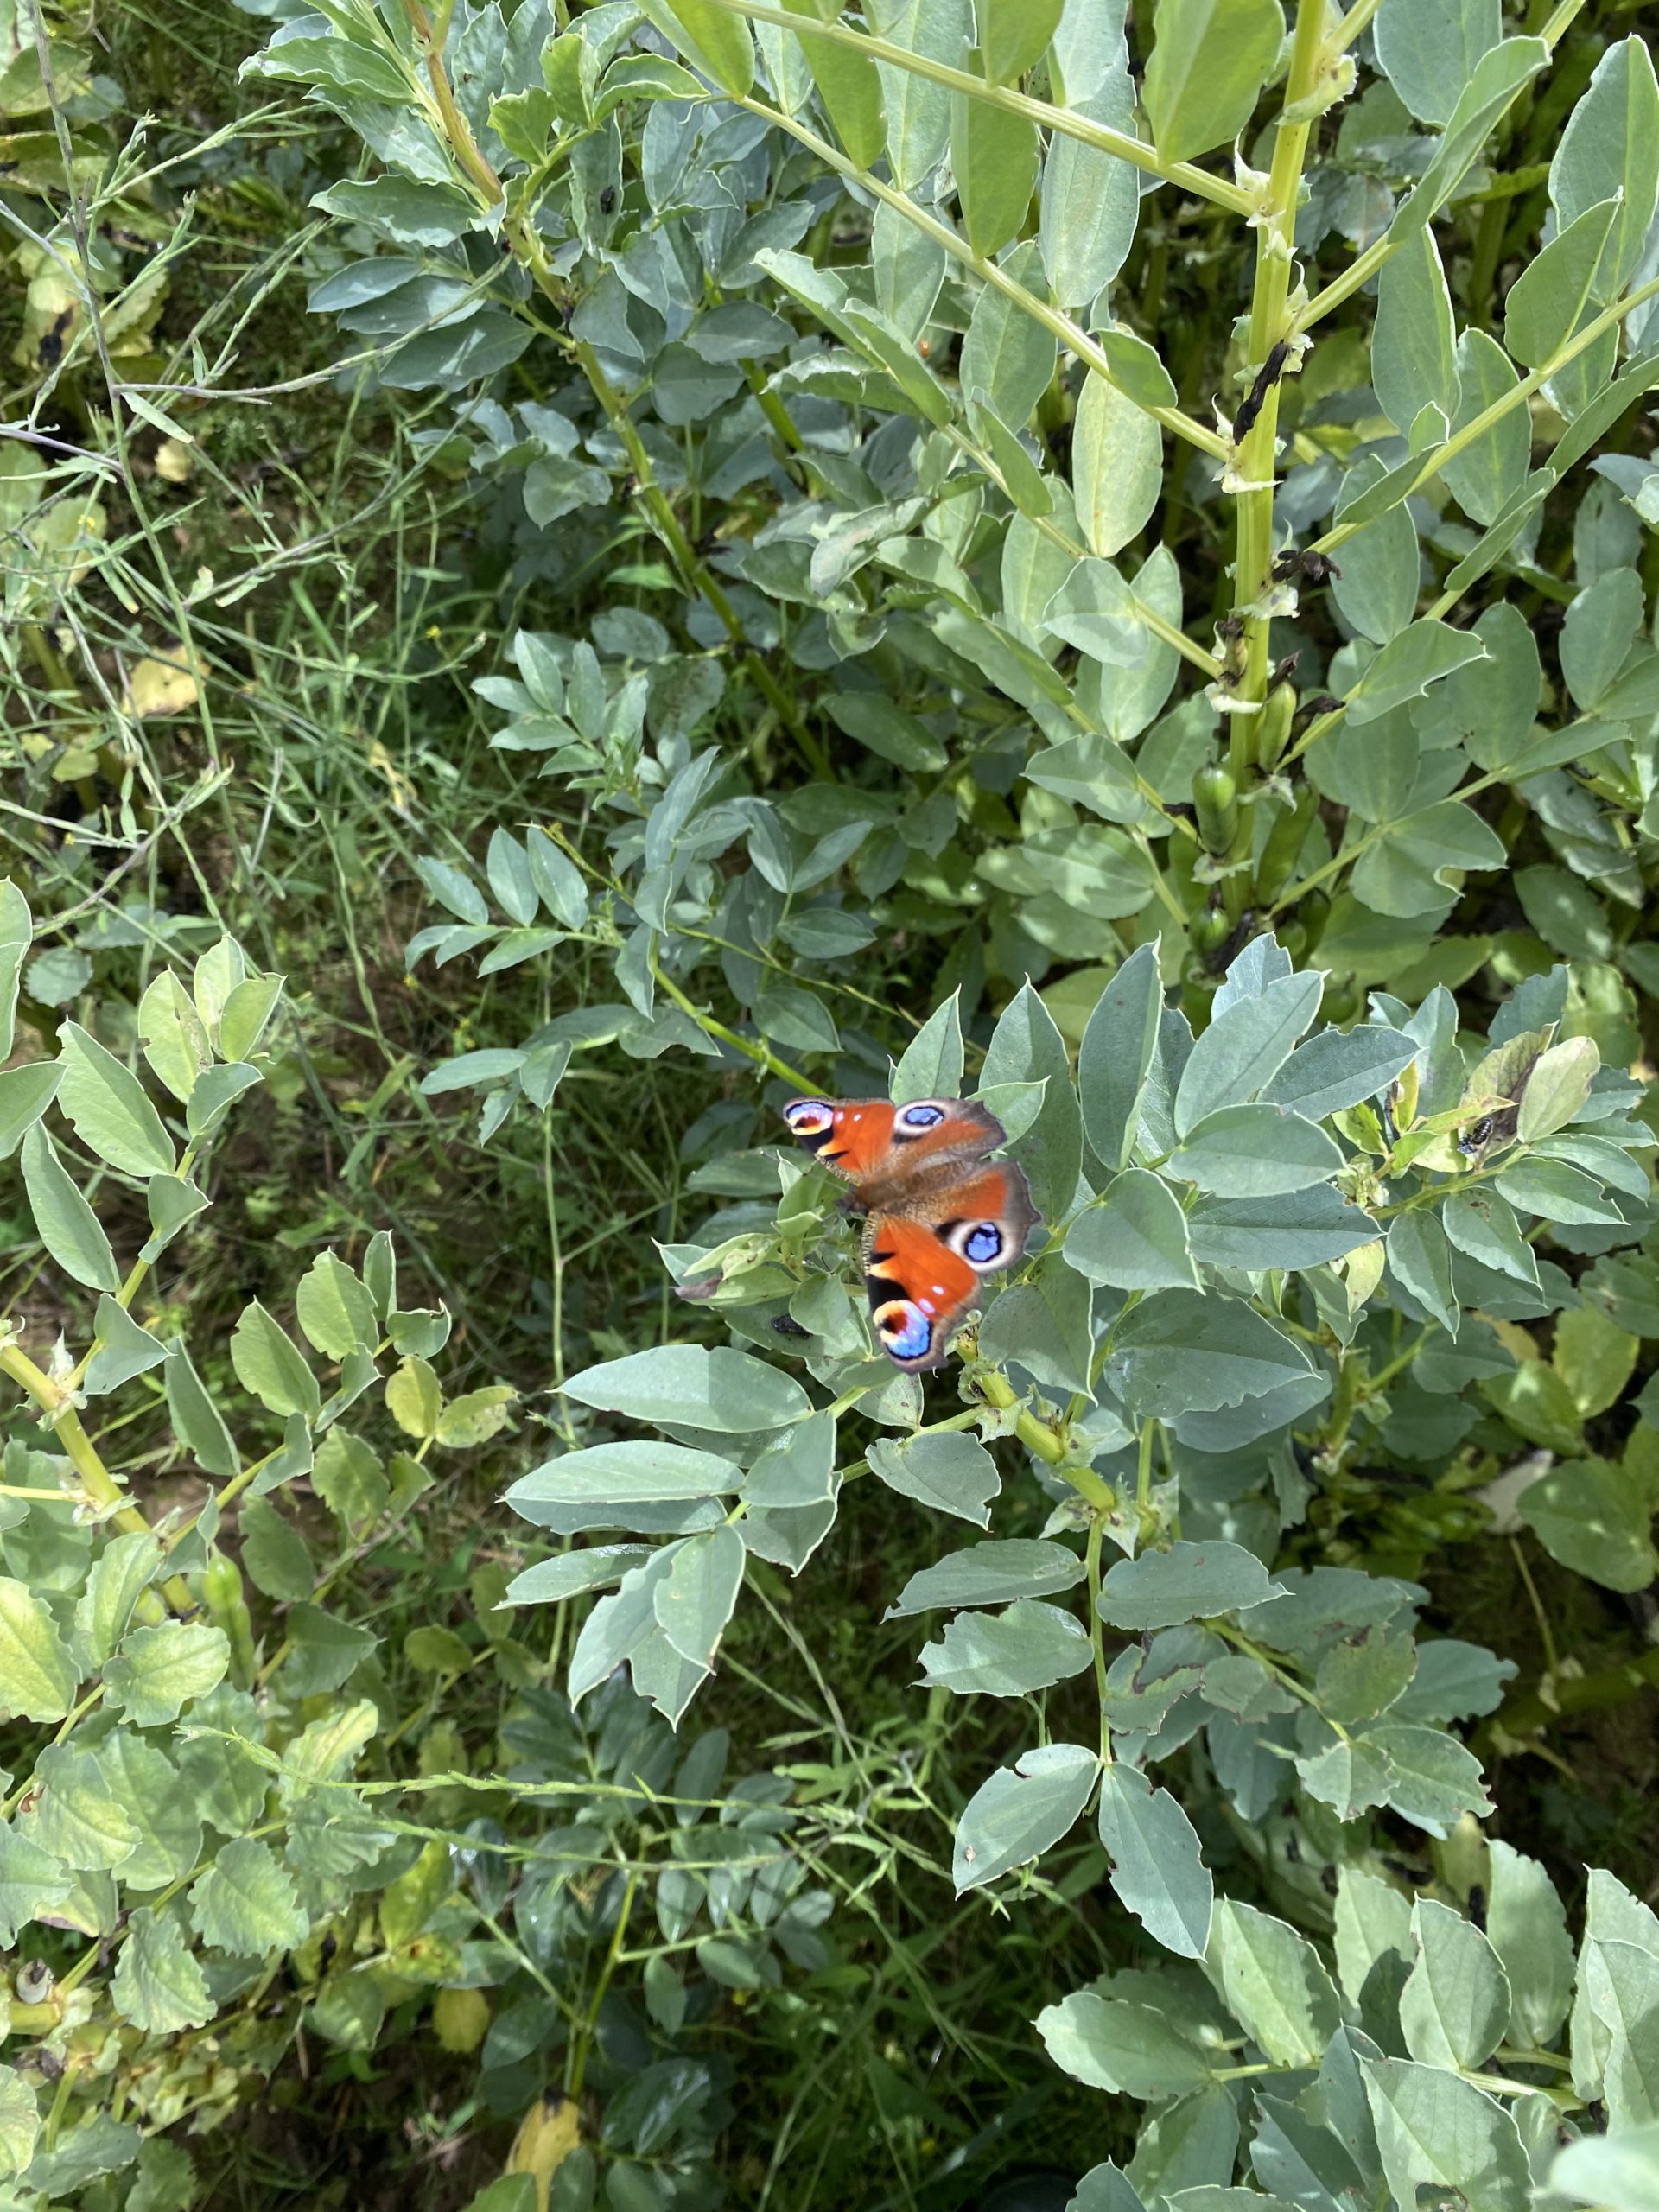
Legumes
The blog wouldn’t be complete without talking about legumes. Approximately 78% of the air is nitrogen. If we can harness the power of leguminous plants to fix some of that nitrogen, we can cut costs by reducing the amount of artificial fertiliser whilst also minimising our environmental impact. Consider incorporating peas or beans into the rotation as stand-alone crops, clover as a companion crop or include legumes as part of a cover crop mix. Farmers are often able to reduce the amount of bagged fertiliser used after legumes.
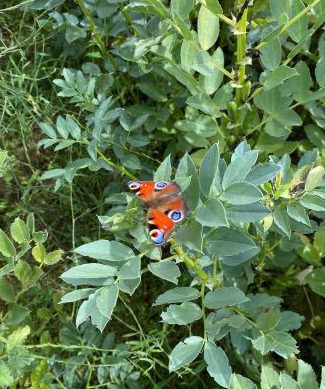
Legumes to build fertility: field beans in an arable rotation
If possible, trial a small reduction across a proportion of the field first and see how your yields fare – you might be pleasantly surprised.
Cover Crops
Utilising cover crops between winter and spring cropping is an excellent approach to building soil health in between cash crops: stabilising soil structure by maintaining living roots in the soil throughout the year, feeding the soil biology and acting as a buffer protecting the soil from adverse weather conditions.
On top of this, one of the biggest advantages of cover crops is that they are great at scavenging and holding onto residual nutrients left over from the previous crop, reducing losses from leaching. Once destroyed, the nutrients will be released back into the soil, improving nutrient use efficiency, and potentially enabling a reduction in artificial inputs required by the next crop.
Cover crop mixes should be tailored to your needs and soil type. It’s better to choose species type based on what you are trying to achieve: building fertility, keeping the ground covered, and/or alleviating compaction.
If possible, conduct trials and aim to include 3 or more species in the mix to capitalise on diversity in both the above-ground biomass for optimised photosynthetic potential (think assortment of leaf shapes to increase surface area from which to harness the sun’s energy), and below-ground biomass through varied rooting structures, depths, shapes and sizes (pumping sugars and carbon into the soil, building soil organic matter and feeding the soil biology).
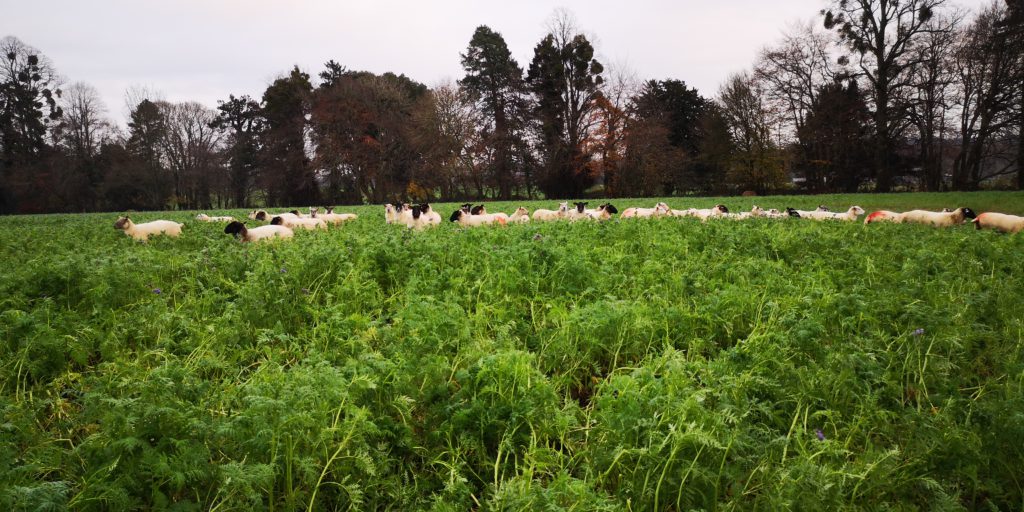
Livestock Integration
Integrating grazing livestock into your rotation offers an alternative technique to destroying cover crops whilst also adding valuable organic matter to the soil in the form of manure. Including grass and clover leys also gives the ground a break, allowing time for recovery and offers another income stream from grazing or silage / hay making. The benefits of perennial roots in the ground over an extended period, especially if a mix of roots at different depths, will help to improve soil structure and build fertility for future crops.
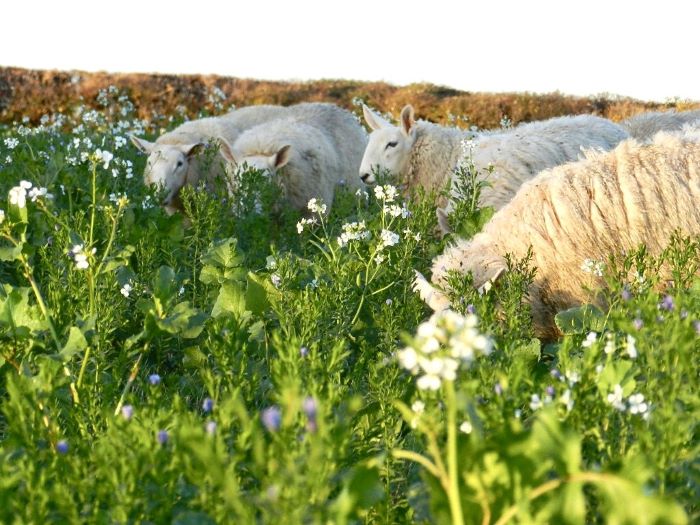
Grazing livestock returning soil organic matter and building soil health.
Explore the Sustainable Farming Incentive options to see if herbal leys or a 2-year legume fallow could be economically viable.
Monitoring and Adapting
It is important to remember that there is no one-size-fits-all approach; be adaptive and tailor options to local environment and conditions. Trial different methods and see which suits your system best.
Regularly monitoring soil health, accounting for all nutrient sources, and keeping an eye on pest and disease prevalence alongside crop performance and weather is crucial to make informed adjustments to rotations as needed.
In summary, farmers are in a unique position in that yes, we produce emissions in the process of producing nutritious food however, we can also build soil health and boost biodiversity simultaneously contributing to offsetting our own emissions and future proofing our farms and landscapes. Implementing a sustainable crop rotation in the UK is not just about growing crops; it’s about promoting a future where productivity and soil health co-exist. By diversifying crops, integrating legumes, embracing cover crops, minimising tillage, incorporating livestock, and tailoring practices to local conditions, it is possible to achieve a resilient and sustainable agricultural landscape supporting local and wider communities for years to come.
We use cookies to ensure that we give you the best experience on our website. This includes analytics cookies to understand website traffic and how users interact with our website. We do not use any advertising cookies.
You may accept or refuse our use of cookies, or learn more at the link provided.
Strictly Necessary Cookies
Strictly Necessary Cookie should be enabled at all times so that we can save your preferences for cookie settings.
If you disable this cookie, we will not be able to save your preferences. This means that every time you visit this website you will need to enable or disable cookies again.


Recent Comments